For Datwyler, sustainability means operating successfully in the present, while also being oriented toward the long term and delivering more value for all stakeholders.
3.1 Highlights
Successful strengthening of human rights in key documents and processes
Social
Achievement of the EcoVadis Gold rating, ranking in the top 5% of all evaluated companies worldwide
Environment, Social, Governance
Achievement of an Employee commitment rate of 85, which is above industry benchmark
Social
Increased the amount of electricityfromrenewable sources to 38.3%
Environment
Offering first PCF analyses to customers based on requests
Environment
Strengthening the credibility of non-financial information through external assurance
Environment, Social, Governance
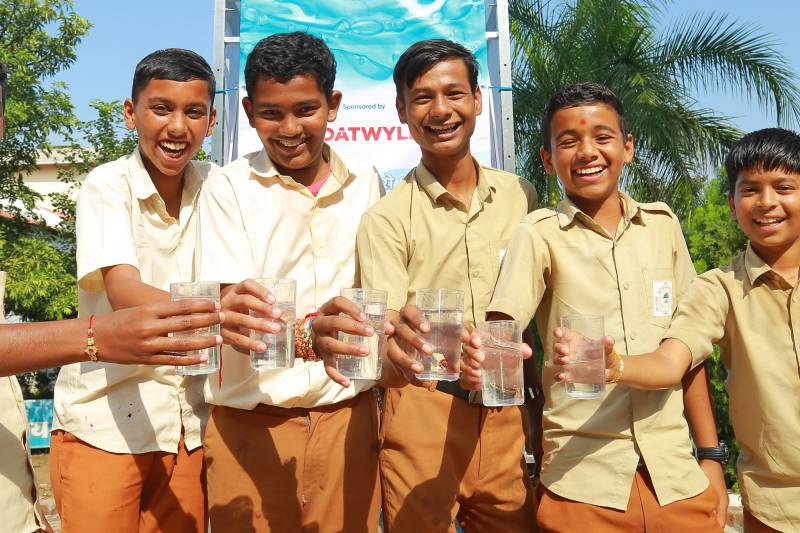
70% of sites engaged in at least one external community activity
Social
Driving forward sustainability despite a challenging environment
We are aware that our own activities, as well as upstream and downstream activities, have an impact on the economy, the environment, people, and society. Conversely, we are also affected by ecological, social, and regulatory developments. In our sustainability strategy, we consider the topics that are of particular importance in one of these dimensions. The focus is on twelve focus topics, which are structured according to the globally established ESG (Environmental, Social, and Governance) scheme. Each topic bundles activities related to current and future projects and contains clear responsibilities with measurable targets and quantifiable key figures for effective management.
As early as 2009, we joined the UN Global Compact and committed ourselves to complying with its ten principles on human rights, labor practices, environmental protection and anti-corruption.
And for the sixteenth time, we are publishing a sustainability report in accordance with the GRI Standards. This report also fulfills the new legal requirements in Switzerland for reporting on non-financial matters.
We have always seen sustainability as an integral part of our business, even in a challenging environment, and are driving it forward for the benefit of all our stakeholders. This is demonstrated, among others, with the Executive Management function "Sustainability and operational excellence". In order to embed the topic of sustainability even more firmly in the company, we have included three sustainability metrics with a total weighting of 20% in the calculation of the variable incentive for all eligible employees.
EcoVadis Gold and increased focus on human rights
In the year under review, we were awarded the Gold standard for our sustainability performance by EcoVadis for the first time. This shows that we made further progress and are fulfilling our social and environmental responsibilities with a clear sustainability strategy.
In order to meet market trends and new regulatory requirements, we have updated our sustainability strategy and are now putting an even higher focus on the topic of human rights. We want to increase all of our global operations’ and employees’ awareness of the human rights topic and the potential impacts on human rights, not only in our own operations but also along our value chain. That's why we have worked on a human rights policy, risk and impact assessments, stakeholder consultations, and the identification of salient human rights issues.
True to our mission «We materialize ideas for a safer, smarter and more sustainable world», we support our customers in implementing innovative systems and, among other things, make an important contribution to the safety of patients and drivers around the world.
In addition, our new components and materials for electric vehicles support the transformation to e-mobility and the achievement of climate targets. The electrical connector seals from the acquired QSR are also making a particular contribution to this.
Dr. Paul Hälg, Chairman
Dirk Lambrecht, CEO
Sabrina Gérard, CSO
3.2 Dedication
Video content
This website uses no cookies by default and hides content which requires cookies to be displayed. If you want to see content like this you have to allow third party cookies. Read more about cookies in our Privacy policy.
Business model
Datwyler produces system-critical elastomer components for customers in global markets such as Healthcare, Mobility, Connectivity, General Industry, and Food & Beverage. The key raw materials for this business are elastomers, plastics, aluminum, metals, and operating supplies. With more than 25 sites on four continents, Datwyler has a global production footprint with own elastomer mixing sites, mold shops, and new and dedicated sales and R&D centers close to its customers.
Datwyler's internal value chain encompasses the engineering of products, the designing of production processes, the manufacturing of product-related equipment such as molds, the mixing of compounds, the internal manufacturing processes such as calendering, molding and trimming, and the packaging of components. The components are then supplied to over 1'000 customers in more than 100 countries, where they are assembled into final systems or a final product. Our net revenue, totaling CHF 1'151.5 million, is mainly generated in Europe (CHF 608.1 million), North and South America (CHF 316.7 million), and Asia (CHF 219.9 million). Other regions are summarized in "other markets" and generated net revenue of CHF 6.8 million.
More details on the products and services can be found in chapter 2 Business Areas of this report.
Datwyler generic value chain (reflecting inputs from a diverse team of internal specialists).
Tier 2+ suppliers
Suppliers of monomers, base chemicals
Suppliers of silicon (silicon sand mining)
Suppliers of aluminium ore (bauxite mining)
Suppliers of other ores and minerals (e.g. talc clay mining) / Suppliers of natural rubber
Suppliers of processed raw materials used by Tier 1
Tier 1 suppliers
Suppliers of raw materials and semi-finished parts (rubber, silicon, aluminium, inserts, etc.)
Waste/scrap and water treatment in own operations
Sales & Distribution
Sales activities to promote and sell Datwyler products
Distributors of Datwyler products
Customers, End-Users
Assembly of Datwyler components into final systems (direct customers)
Assembly system into final product (OEMs)
Use of the final product (end-user/consumer)
End of life
Disposal, reuse, recycle of Datwyler components
Disposal, reuse, recycle of final products using Datwyler components
About Sustainability at Datwyler
Sustainability is about balancing economic, social, and environmental responsibility. Within the Datwyler Group, sustainability is one of four strategic priorities embedded in everything Datwyler does, from product development and production to customer support and human resource management.
Given the considerable importance of sustainability to the company, employees, and communities where it does business, Datwyler has integrated the sustainability report into the annual report since 2022 and applied the GRI Standards as an external reporting framework. We also provide a reference table that shows the relationship between our material topics and the non-financial matters in accordance with Article 964b of the Swiss Code of Obligations.
News and stories
Datwyler is continuously working on the implementation of its sustainability objectives and reports on this in current news and stories on its website.
This website uses no cookies by default and hides content which requires cookies to be displayed. If you want to see content like this you have to allow third party cookies. Read more about cookies in our Privacy policy.
Decision maker in charge for sustainability
Ambitious sustainability goals can only be achieved if they are carried across all units and levels of a company. At Datwyler, the entire management team is committed to sustainability and drives developments in their individual areas of responsibility.
External ESG developments
In recent years, corporate sustainability has gained significantly in importance, especially for listed companies. The primary driver has been the increasing global risk of climate change, which has been playing a major role in politics and society.
These external ESG developments are taken into account in the annual review of the sustainability strategy to ensure that Datwyler's strategy, including the focus topics and objectives, is aligned with the market trends we observe.
Responding to climate change
Increased attention of regulators, investors and large customers for ambitious climate goals for the whole value chain
Exponential growth of SBTi commitments and scope 3 analyses
Mandatory disclosure of climate governance, risks, and strategy (TCFD guidelines)
Growing customer preference regarding low carbon products and solutions
Increasing ESG regulations
Regulatory focus in EU and globally on climate change, labor inequality, human rights, diversity, equity and inclusion, and social justice for all businesses, including reporting on non-financial matters and due diligence
Far-reaching ESG regulations for financial industry and investors
Increased demand from investors and customers to perform in ESG ratings & rankings
Increasing expectations to assure sustainability information and data
Embed ESG in business operations
Integrating ESG risks in corporate strategy and risk management
Increasing number of businesses with integrated reporting of financial and non-financial performance
Accelerating the transition towards a circular economy and circular products
Integrating sustainability aspects into product development
Protecting social and human rights
Increased requirements from regulators, investors, and NGOs on diversity in management and workforce, and on protecting human rights
Regulations pertaining to human rights, health & safety, and environment
Far-reaching regulations on responsible supply chains
Industry-specific sustainability trends
Supply chain disruptions
Healthcare: accelerating digitalization
Shift toward eMobility
Sustainable packaging
«Advance Sustainability» as proactive strategic priority
For Datwyler, sustainability means operating successfully in the present, while also being oriented toward the long term. Thus, the company wants to not only be responsive to current global and market trends, but to proactively contribute to shaping a sustainable future. A long-term orientation means striking a balance between economic, environmental, and social aspects in all decision-making processes. To measure our progress in advancing sustainability, we take sustainability ratings into account as they give us a comprehensive overview of where we stand, focusing on several aspects of sustainability. Our goal is to be in the top 25% within our industry in all relevant sustainability ratings by 2030.
Datwyler’s vision is to become a truly sustainable company focused on people, planet, and profit. This vision is inspired by the company’s intrinsic motivation to safeguard what is most essential for the business and its shareholders, customers, workforce, and their families. Building on more than 100 years of corporate history and over a decade of sustainability achievements, when Datwyler made sustainability a strategic priority in 2020, it reinforced the importance of integrating sustainability across the company’s activities.
3.3 Focus topics
For over a decade, Datwyler has been dedicated to reporting in accordance with the GRI Sustainability Reporting Standards, showcasing a steadfast commitment to transparency and accountability in the area of sustainability. Early on, Datwyler recognized the importance of materiality analyses guided by GRI principles.
Datwyler conducted a first comprehensive analysis in 2016. This entailed the collection of a long list, including those rooted in sustainability standards, industry relevance, and alignment with Datwyler's corporate strategy. These topics were discussed in workshops involving the extended management team and the Executive Management. Topics were assessed in terms of relevance from management and stakeholders.
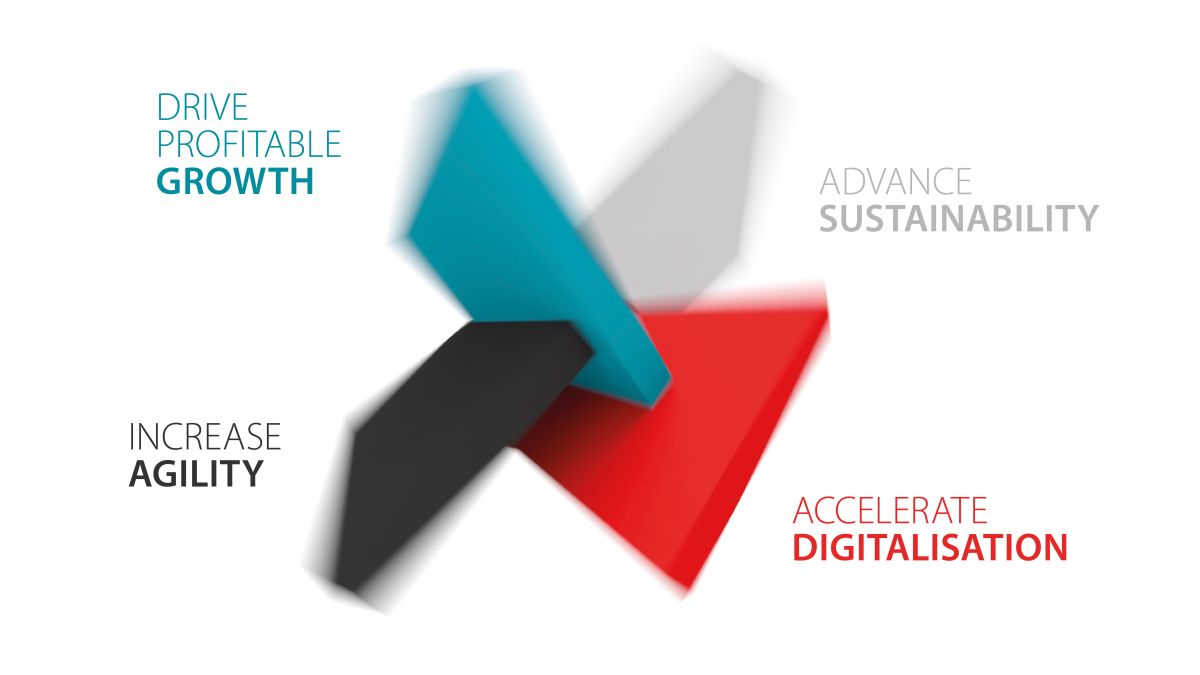
In 2021, as part of crafting its sustainability strategy, Datwyler revisited and updated its material topics. The material topics were evaluated regarding Datwyler's impact on the economy, society, and the environment. The result was validated and approved by both the Executive Management and the Board of Directors. The extended management team played a key role in the alignment of these material topics with the strategy and objectives. Of the 15 topics that are material for Datwyler, twelve focus topics form the core of Datwyler's ESG strategy. The three additional material topics - drive profitable growth, accelerate digitalization, and increase agility - are part of the overarching corporate strategy.
In 2023, Datwlyer revisited the materiality analysis again. Four material topics underwent adjustments to better reflect the evolving sustainability landscape, all while being evaluated regarding business relevance (business materiality) and impact on the economy, society, and the environment (impact materiality).
To foster a holistic approach to environmental concerns encompassing the entire value chain, Datwyler transitioned from "Sustainable procurement" to "Sustainable supply chain".
Acknowledging the significance of a "Safe and healthy workforce" in its sustainability efforts, Datwyler integrated this focus into the broader theme of "Employer of choice", recognizing its substantial contribution to employee satisfaction.
In response to emerging requirements, including new legislation regarding human rights, Datwyler introduced a new social focus topic, "Human rights and equal opportunities", previously mentioned under "Compliance and ethics".
Datwyler expanded the scope of the topic "Diversity of the Board of Directors and Executive Management" to "Lead by Example", acknowledging the pivotal role of every leader in the sustainability journey.
No external stakeholders were involved in this process. The result was approved by the Executive Management and the Board of Directors.
For 2024, Datwlyer is planning a new double materiality assessment. This will align with the guidelines of the EU Corporate Sustainability Reporting Directive (CSRD), encompassing both external and internal stakeholders.
Twelve ESG focus topics for further development
Datwyler structures its commitment to reducing its environmental footprint and creating added value for all stakeholders around an ESG landscape with twelve focus topic. The focus topics are structured according to Environmental, Social, and Governance (ESG) priorities and are intended to close gaps and build on existing strengths.
A separate allocation of Datwyler's material topics on non-financial matters according to the Swiss Code of Obligations is given in a corresponding reference table.
Negative impacts on the environment, people, society, and the economy can occur at all stages of our products' lives - from raw material extraction to production, distribution, and use through end of life. Although we endeavor to avoid these wherever possible or at least mitigate them to a certain extent, the nature of our products and activities means that this is not always possible. Our activities and products have an impact in the following ways:
Environmental impact
Our activities - particularly those in the upstream value chain - have an impact on the environment. This takes the form of greenhouse gas emissions as well as air, soil and water pollution, caused in particular by the production of the raw materials we procure, our own production, transport, and final disposal. Datwyler is focusing on greenhouse gas emissions in this report, since we do not obtain a full air pollution balance (e.g. on volatile organic compounds) at group level at the moment. Air pollution is handled on a site-specific basis, taking into account the different local regulations. We will assess whether a full air pollution balance at group level will be published in future.
All employees along the value chain and the communities near our production sites are affected by our activities. We are aware of the ecological footprint of our activities and those for which we are indirectly responsible, and try to avoid, minimize and mitigate the negative effects on the environment. To reduce the environmental impact further, we enable the transition to more environmentally friendly mobility with our new components and solutions for electrified vehicles in cooperation with our Mobility customers.
Social impact
We have an impact on various external stakeholders in our upstream and downstream supply chain. The focus of our efforts to avoid negative impacts is on the protection of the health of the employees and on the protection of human rights. Following a risk assessment exercise involving several internal teams (covering different geographies, businesses, or roles) and also external parties, we have defined those human rights areas that are seen as more salient in our value chain, i.e., presenting higher risk and severity of a potential impact. Those are:
Consumer & product safety
Environmental issues impacting human rights
Child labor
Forced labor
Occupational health and safety
Labor conditions
Corruption
Our Healthcare components for injectable drugs are of crucial importance for the health and the well-being of humanity. The quality of these products is key to preventing undesirable negative effects. At a strategic level, our focus is on securing the availability of important medicine components in partnership with our customers. The pandemic has shown that a shortage of Healthcare components could have serious negative consequences for the population. We were a main supplier of vaccine components and acted successfully as a critical supplier during the pandemic.
Impact on employees
Datwyler is often one of the largest employers in the regions in which we operate. Therefore, we have a potentially significant impact on those regions' available work opportunities and, consequently, enhance prospects for employees. We aim to play an active role in creating job opportunities, attracting talents, providing development opportunities, offering volunteering work, and supporting the communities in which we operate.
The physical and mental health of our employees can be influenced by their work. There are aspects that can affect all employees - such as pay, vacation, corporate culture, or ergonomics - and aspects that affect employees in production in particular. Depending on their place of work and area of responsibility, the latter group of employees may be in contact with hazardous substances or operate in a noisy environment. Datwyler has internal processes in place that help mitigate health and safety-related risks and protect our employees.
Governance impact
We operate in countries with a certain risk of bribery. However, we strictly prohibit any special treatment, bribery, corruption, or any other form of fraud or money laundering activities, which is clearly stated in our Code of Conduct, anti-fraud and anti-money laundering policies, to avoid supporting or, in the best case, preventing any anti-competitive and corrupt processes.
Internal stakeholders (Executive Management, site directors, employees) and external stakeholders (suppliers, customers, investors, contractors) could be impacted by a fraud incident, so all internal stakeholders receive regular training to raise awareness regarding the risk of bribery and all stakeholders have the possibility to report compliance cases / potential fraud cases (e.g. corruption, bribery) through Datwyler's whistleblowing hotline.
Our anti-corruption measures are intended to promote an open and honest culture and to make our employees aware in advance of any disadvantages or other damage caused by corruption incidents. We also want to make a general contribution that is in line with our principles in the Code of Conduct and is part of Datwyler's corporate culture. Preventive measures help us to avoid greater damage and raise the awareness of each individual employee.
Open dialog
The Datwyler Group maintains an open dialog with all stakeholders. This is also applicable to our employees. Regular employee surveys provide the foundation for continuous improvements. Our employees are free to join trade unions or form internal employee representative bodies. Where employees have decided to form internal employee representatives, we maintain a constructive dialog with them in accordance with legal requirements. By referring to our ESG strategy and our climate transition plan at all our shareholder and investor touchpoints and by discussing ESG topics with our customers, suppliers, and contractors, we regularly collect external feedback.
Top 10 goals
To make the ESG focus topics more tangible, Datwyler developed its top 10 sustainability goals for 2030.
Climate-neutral operations (scope 1+2) by 2030 mainly based on a Science Based Targets (SBT) compatible reduction pathway
Difference in absolute scope 1 and 2 emissions in tons CO2 equivalent (eq) compared to base year 2023
Due to the fact that the base year is defined as 2023, this KPI can only be measured from 2024 onwards. However, compared to 2022, the absolute CO2eq emissions could be reduced by 0.4% in 2023.
Product carbon footprint available for each new product
Percentage of new products covered by a product carbon footprint analysis
In 2023, the focus was on the processes for calculating the product carbon footprint (PCF), and initial PCF analyses were carried out for typical products for Healthcare and Industrial Solutions. From 2024, we will start to measure the percentage of new products for which a PCF has been assessed. In the case of existing products, we will determine on an ad hoc basis which products are to be analyzed.
High rankings in customer service rating for sustainability
Score for sustainability related questions in customer questionnaires
The number of questions on sustainability in the customer satisfaction survey was increased in 2023 in order to better understand how customers perceive our sustainability performance. In the questions on different aspects of sustainability, customers rated our performance better than that of our peers.
Embed human rights due diligence and considerations in all applicable key processes, contracts, and relationships along the value chain
Number of processes and documents where human rights topics are embedded
In 2023, besides key processes such as establishing a human rights policy and doing a human rights risk and impact assessment, we further embedded human rights topics in key documents such as our employees Code of Conduct, Supplier Code of Conduct, and in the business continuity planning process.
Be among the top 25% within our industry in all relevant sustainability ratings
Percentage of relevant ratings where we are among the top 25% within our industry
In 2023, Datwyler has already achieved this for the following ratings: EcoVadis (top 2% within our industry) and Sustainalytics (top 9% within our industry).
The 2030 Agenda for Sustainable Development was adopted by all United Nation Members States in 2015. The 17 Sustainable Development Goals (SDGs) provide a shared blueprint for peace and prosperity for people and the planet, now and into the future. As a reliable partner, we fulfill our social and environmental responsibilities and contribute to the achievement of the UN Sustainable Development Goals.
In the area of Governance, Datwyler focuses on continuous development of transparency, lead by example, commitment, such as integrating a sustainability component into variable pay for all bonus-eligible employees and compliance and ethics, such as a proactive chemical compliance management.
ESG Governance
Oversight and execution of the sustainability (ESG) strategy at Datwyler
A strong governance framework is key to ensuring that the sustainability (ESG) strategy Datwyler has committed to is incorporated into the corporate agenda.
The governance of sustainability (ESG) is integrated into the corporate governance structure throughout the Group – from Board level to Management level, Group functions, Business Units and all employees.
Datwyler Board of Directors
The highest governance body at Datwyler is represented by the Datwyler Board of Directors (BoD) and has overall responsibility for Datwyler’s ESG strategy and reporting.
In line with the Board of Directors’ responsibility to determine the principles of corporate strategy (see the Corporate Governance section), the Board oversees the Executive Management on matters required to enable:
the Datwyler Group to operate on a sustainable basis for the benefit of current and future generations;
the development and adoption of the Datwyler Sustainability (ESG) Strategy and related policies, including the Sustainability (ESG) landscape and the top 10 goals;
the effective management of ESG related risks;
the communication of critical concerns to the highest governance body;
the development of ESG knowledge at BoD and group level.
While the Board is responsible for oversight, the Datwyler Executive Management ensures the implementation of the Sustainability (ESG) Strategy.
The Executive Management
Implementation responsibility for sustainability (ESG) lies with the Executive Management consisting of the C-level.
The Executive Management has defined ‘advancing sustainability’ as one of the four strategic priorities and has established sustainability (ESG) related objectives for the organization. For each objective measurable Key Results are defined and led by a Key Result (KR) owner.
The CSO (Chief Sustainability Officer) coordinates the sustainability activities within the organization and has regular exchange meetings with the KR owners.
Business integration
The Objectives and Key Result (OKR) system uses an iterative approach which facilitates to handle complex topics in an agile way. The Key Result (KR) owners initiate and track key activities related to their Key Result and discuss progress and challenges on a regular basis within their team and with their respective leaders.
Everyday sustainability topics are managed, as appropriate, by the sustainability functions, business units, sites and other corporate functions such as human resources, procurement, technology and innovation, communications, development, engineering, and compliance.
All Datwyler employees contribute to the Datwyler sustainability journey.
Collective knowledge of the highest governance body
Annual knowledge exchange sessions are organized for the BoD members with the goal of advancing the collective knowledge, skills and experience in sustainable development.
In 2023, the following topics were presented to the BoD:
Understanding the ongoing sustainability trends from a market, customer and compliance point of view (BoD meeting May 2023)
Datwyler’s ongoing and planned sustainability activities to respond to these trends (BoD meeting May 2023)
Review of the sustainability strategy including SWOT analysis, focus topics, top 10 goals (BoD meeting May 2023)
Deep dive into the topic of scope 3 and SBTi as well as human rights due dilligence (BoD meeting May 2023)
Deep dive into the new legal requirements in Switzerland for reporting on non-financial matters and the associated responsibilities of the BoD (BoD meeting September 2023)
ESG reporting standards carried out by KPMG (Audit Committee meeting December 2023)
Review of the 2023 sustainability report (Audit Committee and BoD meeting December 2023)
Evaluation of the performance of the highest governance body
Each year the BoD Chair takes the initiative to evaluate the skill set of the BoD members by using an independent evaluation questionnaire assessing e.g. leadership, culture, role clarity, teamwork, accountability, decision making, communications, board operations. This questionnaire includes economic, environment, social and governance related questions.
The questionnaires are completed individually and reviewed by the Chair. Actions to close gaps related to the boards operation and skill set are taken if needed.
As a globally active company, Datwyler has an institutionalized and systematic risk management system. Risks are divided into four categories: strategic, operational, financial, and compliance. ESG risks are translated into one or several of these business risk categories according to their impact at Group level as well as at business units and production site levels.
Environmental risks
When it comes to environmental risks, global warming contributes to more unpredictable events, such as natural disasters or droughts (see TCFD report). This could impact the current products and business models as the market might need to change to address those risks. One example is that a scarcity of water could have a severe impact on our business because it is an essential input for the washing of Healthcare components.
In addition to risks with a broad effect, our industry is also exposed to specific environmental risks. Therefore, we are monitoring the evolvement of stricter environmental regulations such as, for example, a potential ban on specific chemicals because of their environmental impact (e.g. fluoropolymers). Alongside monitoring new potential regulations, we also assess the impact those might have on our operations and products and define potential action plans. A delayed adoption of environmental changes/requirements could impact the business model and products - therefore an ongoing and proactive adoption of needs and demands must be fostered. Another potential risk is related with carbon taxes, which could lead to increasing costs of raw materials and energy.
Social risks
Increasing regulation means that social risks are on the rise. Until now, misdemeanours in the area of supply chain due diligence were primarily associated with reputational risks. As a result of the legal obligation, human rights issues are receiving more attention and now entail financial and litigation risks.
Employee-related risks
Datwyler is dependent on access to committed and skilled employees to meet its operational needs. Due to demographic trends in countries where Datwyler has operations, there is a potential risk that there will be a shortage of suitable labor in the future, due to an aging and shrinking workforce. This is becoming increasingly evident since around 35% of people in leadership positions within Datwyler are older than 50.
Risks also arise if we are unable to respond quickly enough to the changing demands of a volatile market environment and are therefore unable to fulfill our employees' expectations of a modern working environment, including the demand for a workplace that promotes diversity, equality, inclusion, and belonging. This would not only pose a risk for talent attraction, but also for employee retention.
Governance risks
Regarding governance, there is a risk of not meeting stakeholder expectations if we do not report transparently on our ESG data. Fulfilling this is associated with increasing effort. In many areas, increasing regulatory requirements require additional monitoring of legal and geopolitical developments. This requires additional expertise to be built up within the company or provided by third parties. These circumstances can affect all Business Areas and have a direct impact on operations. At the same time, they mean increased administrative effort to ensure compliance with relevant requirements or new laws.
Due to the new regulatory requirements, there is a particular focus on how companies deal with corruption risks. Corruption incidents, which are an indication of insufficient governance, that are going public might break up business relationships and have an impact on investors (existing and potential) through a decrease in the share price or valuation of the group.
In addition, corruption can cause direct financial damage to local companies and the Group. This may include legal consequences and associated legal costs, as well as fines/sanctions that may be imposed by regulatory or legislative/judicial bodies. In addition, there is indirect financial damage caused by the above-mentioned cases.
Critical concerns include concerns about the organization’s potential and actual negative impacts on stakeholders raised through grievance mechanisms and other processes. They also include concerns identified through other mechanisms about the organization’s business conduct in its operations and its business relationships.1
At Datwyler, critical concerns are immediately reported by the CEO, CFO or CSO to the Board of Directors (BoD). An overview of critical concerns is included in the compliance report, in the annual risk management report and reported to the BoD twice a year by the CFO.
_____
Definition taken from GRI standards, GRI 2: General Disclosures 2021
Focus topic
Transparency
Datwyler believes transparency is fundamental for stakeholders to recognize the company as a reliable partner. The company has consistently disclosed its ESG performance against leading and internationally recognized frameworks and published a sustainability report in accordance with GRI and the ten principles of the UN Global Compact since 2009.
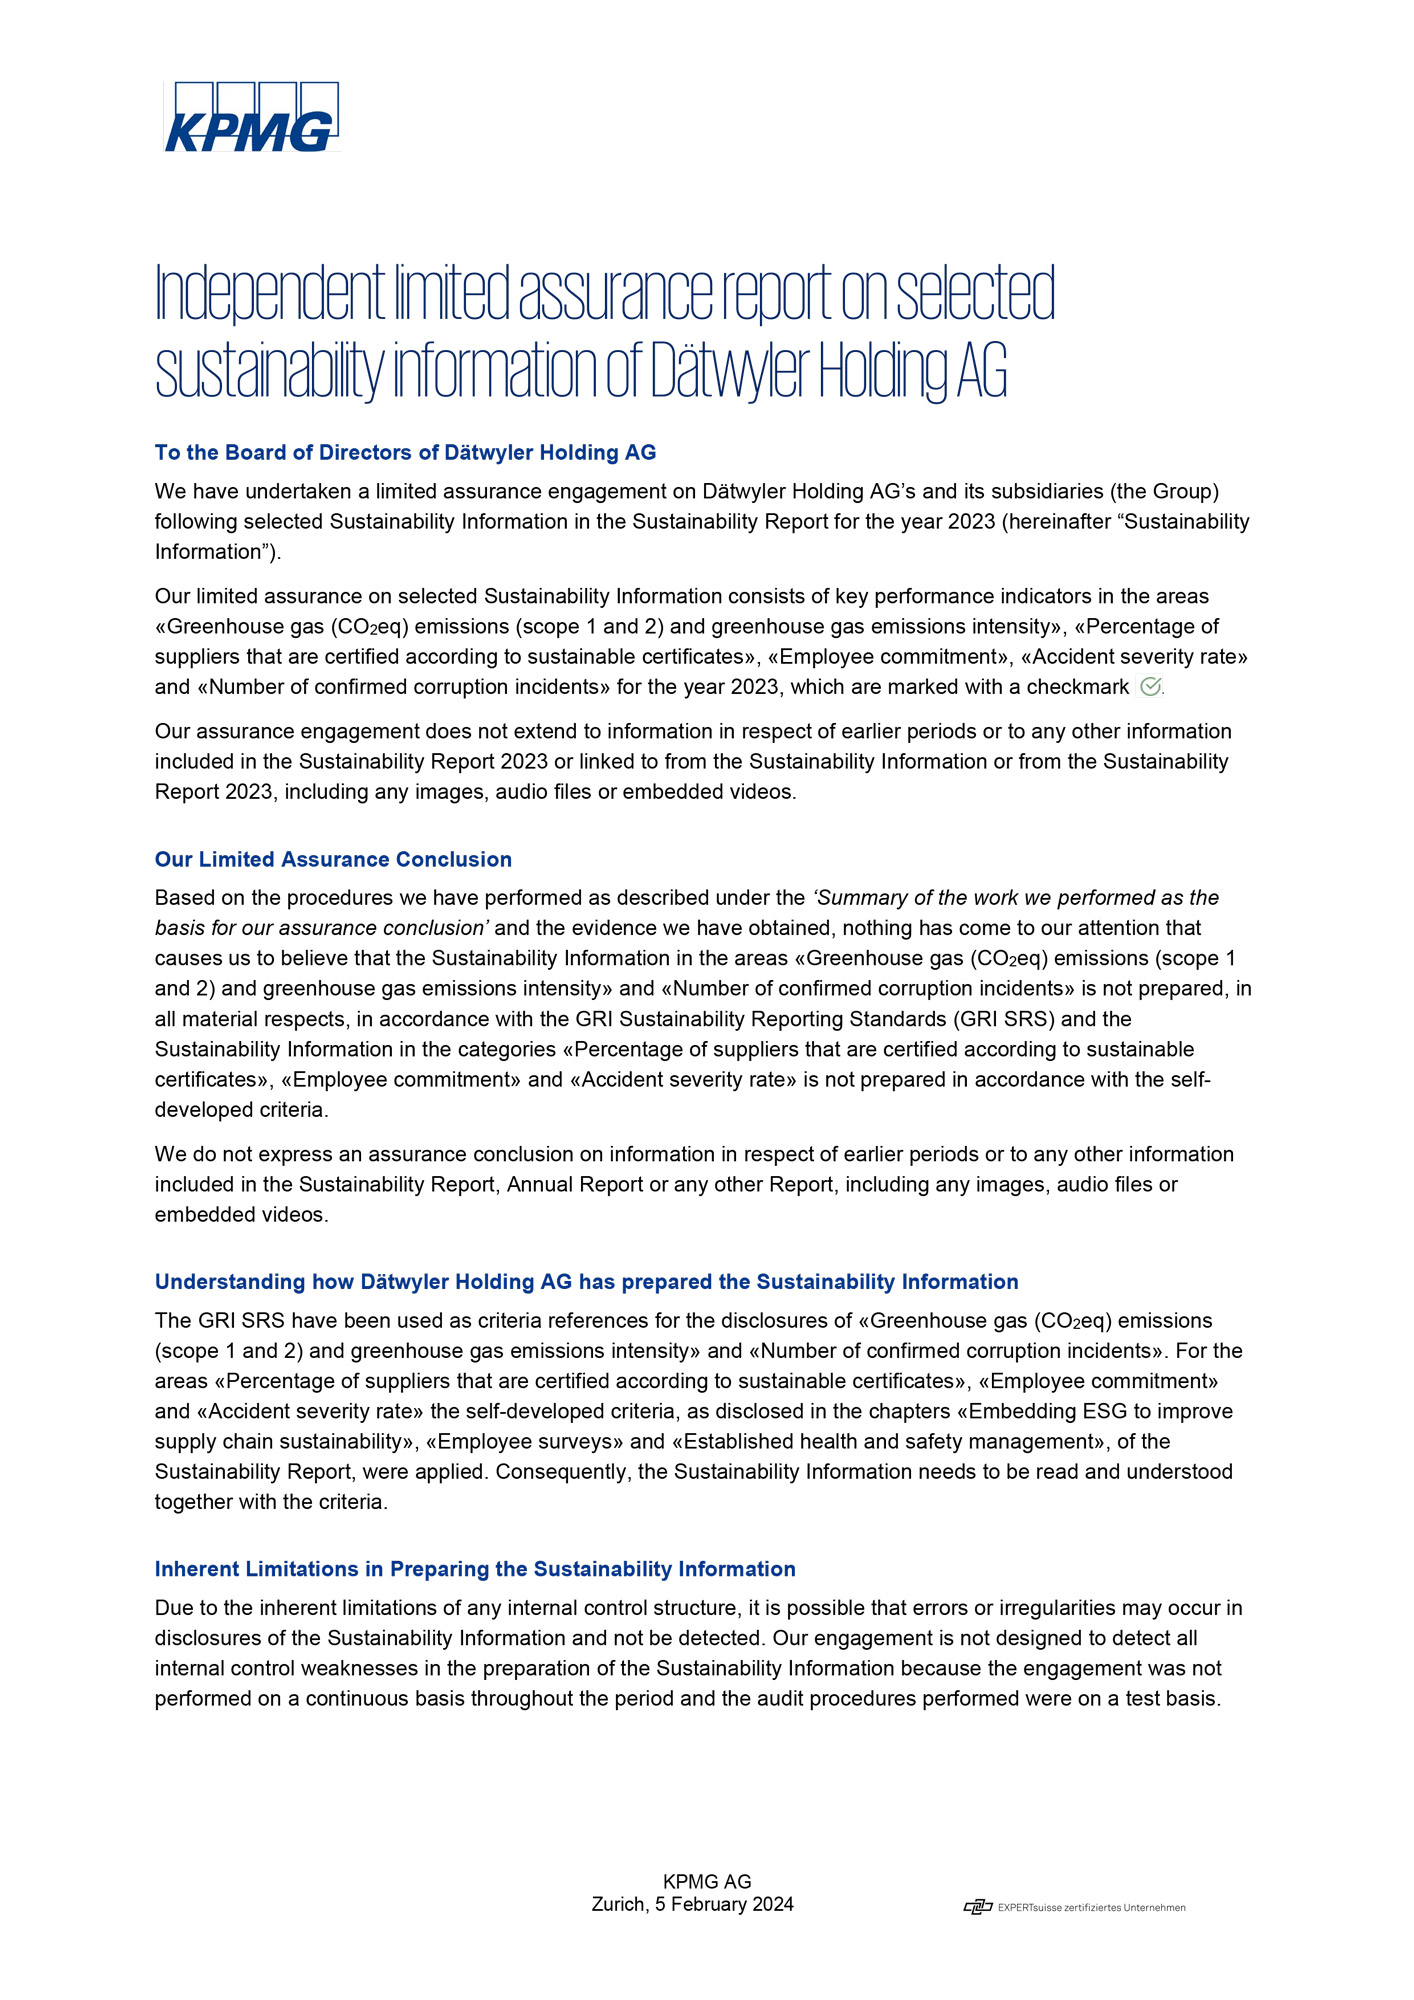
For the first time in 2023, Datwyler obtained a limited assurance on selected KPIs in cooperation with KPMG in order the strengthen the credibility of non-financial information towards external stakeholders. The following KPIs were verified:
Greenhouse gas (CO2eq) emissions (scope 1 and 2) and greenhouse gas emissions intensity
Percentage of suppliers that are certified according to sustainable certificates (ISO 14001, ISO 45001, ISO 50001)
Employee commitment
Accident severity rate
Number of confirmed corruption incidents
The verified KPIs are marked and reported
The company has also disclosed its energy consumption and resulting CO2 emissions to CDP (Carbon Disclosure Project) since 2013, and since 2022 also its water consumption and the impact on deforestation. After receiving the Silver award from the globally recognized rating agency EcoVadis four times in a row, Datwyler received the Gold rating for the first time in 2023. This places Datwyler among the top 5% of more than 100'000 companies from 175 countries that have been analyzed by EcoVadis. In the elastomer industry, the company even ranks among the top 2% of all companies evaluated.
EcoVadis is one of the world’s leading providers for corporate social responsibility (CSR) audits. 100'000 companies from 175 countries have been assessed already.
Datwler aspires to have an industry-leading ESG/sustainability policy framework that is continuously evaluated and improved. Datwyler’s first Code of Conduct—which is binding for all employees at all sites across the Group—was published in 2008. This code mandates that the companies and employees within the Group must respect the national laws, human rights, personal dignity, and privacy of each individual person.
A fair and responsible partner
In its Code of Conduct and with its participation in the UN Global Compact, the Datwyler Group has firmly committed itself to protecting human rights. Additionally, since 2020, sustainability has become one of the Group’s key strategic priorities, reinforcing its commitment with people and planet. To put this into practice, topics related to human rights and sustainability have been embedded in various policies and processes within Datwyler Group, such as its Supplier Code of Conduct, internal audits, or its DEI/ Whistleblowing policies, just to name a few. Since 2022, the internal Global Business Continuity Planning (BCP) process includes enhanced focus on risks related to the environment (cf TCFD), human rights (e.g. child labour) and conflict minerals.
First BCP assessments including the increased risk related focus items were conducted in January 2023 and continued throughout the year. Datwyler has zero tolerance for discrimination, humiliation, oppression, harassment, or insults. The Code of Conduct also articulates how to deal with business partners and competitors, strictly prohibiting any special treatment, bribery, or corruption. For example, clear rules are defined in the code for placing orders, awarding sponsorship money, and dealing with conflicts of interest. When dealing with whistleblowing cases, the general requirements of the EU Whistleblowing Directive (Directive (EU) 2019/1937 on the Protection of Persons Who Report Breaches of Union Law) and applicable local laws are followed.
Datwyler had already been offering its employees a whistleblower hotline for reporting code violations since 2009. A visible whistleblowing hotline that is actively utilized builds trust and reduces the risk of potential corruption and other fraud cases. None of the whistleblower reports received in 2023 were in connection with a corruption case1. Some of the measures adopted to promote awareness and foster compliance include, for example, training on our Code of Conduct, the implementation of a new digital reporting channel, internal audits, and the improvement of compliance case tracking.
Further, site directors have to confirm, on an annual basis, that they comply with general compliance standards required at group level.
Datwyler has defined expectations of suppliers in a separate Supplier Code of Conduct. With a publicly available tax strategy, Datwyler assumes its social responsibility and commits not to engage in aggressive tax planning.
Leading by example is about implementing ESG at all levels of the organization. At Datwyler, we are convinced that fostering leadership must rely not only on the development of individual personalities and their personal strengths, but on an actively shared corporate culture. Only leaders who share our values and truly embody them can succeed in motivating all employees to act sustainably. To achieve that, we have to focus on people empowerment; giving direction, inspiration and power to everyone, and ensuring psychological safety.
Rising diversity in Datwyler’s Board of Directors and Executive Management
Leading by example also encompasses diversity on Datwyler's Board of Directors and Executive Management, which was previously defined as a separate focus topic. Diversity, equity, inclusion, and belonging are becoming increasingly important. Therefore, this should also be reflected in the Executive Management and the Board of Directors.
Regarding female representation in leadership positions, Datwyler has set concrete goals in line with regulatory requirements of the Swiss government: By 2025 the Board of Directors should reach 30% female representation while female representation in Executive Management should reach 20% by 2030. To achieve this goal, Datwyler makes no compromises on the required competencies. However, if different candidates have comparable qualifications, the one who can contribute positively to the diversity of the Board or of Executive Management is preferred.
At the end of 2023, female representation of the Board of Directors was at 25% and female representation on the Executive Management was 20%. Therefore, the Datwyler Group has already reached its 2030 goal at least 20% female representation in Executive Management.
On the basis of the sustainability strategy, the Board of Directors has decided to add a sustainability indicator to the variable incentive model. The sustainability performance indicator determines 20% of the variable incentive and has been applied for members of the Executive Management and for all eligible employees from 2022 onward.
The two previous performance indicators—net revenue growth and EBIT—will be taken into account at a rate of 40% each.
The measurement parameters for the sustainability performance indicator are derived from the twelve focus topics of the enhanced sustainability strategy. They can be redefined by the Board of Directors annually.
The Board of Directors has defined the following three measurement parameters for 2023:
Reduction of CO2eq emissions (scope 1 and 2) in relation to net revenue compared to 2022 (weighted at 50%)
Accident severity rate (25%)
Customer satisfaction (25%)
For all three parameters, there is a minimum threshold that has to be achieved in order to be taken into consideration and a maximum limit above which the contribution to target achievement no longer increases.
By taking sustainability measurement parameters into account in the variable incentive for all eligible employees, Datwyler is promoting awareness of the sustainability focus areas.
In the area of environment, Datwyler focuses on climate-neutral operations 2030, embedding eco-design principles into its products and manufacturing development processes, reinforcing initiatives to ensure a resource-friendly production and working together with the supplier and customer base to enable a sustainable supply chain. Reducing its ecological footprint is an important aspect of sustainability, supported by many of Datwyler's stakeholders.
In parallel with the continuous reduction in relative resource and material consumption, Datwyler is striving for climate neutrality (scope 1 + 2) at its own sites by 2030 mainly based on a Science Based Targets Initiative (SBTi) compatible reduction pathway.
Focus topic
Climate-neutral operations 2030
Climate change poses a critical risk to society and the global economy. The Paris Agreement, which was concluded in December 2015 at the Paris Climate Conference, is the leading global climate protection agreement. The Science Based Targets Initiative (SBTi) guides companies to contribute to the agreement and to develop reduction plans for greenhouse gas emissions that limit global warming to 1.5°C.
Our focus
Datwyler has set a goal to achieve climate neutrality for its own operations (scope 1 and 2) by 2030. This target is mainly based on the 1.5°C reduction path defined by the SBTi, although Datwyler has not yet made a commitment to SBTi. The reduction plan includes implementing measures to purchase renewable energy, increase energy efficiency, and invest in its own production of renewable energy. Datwyler has defined 2023 as the base year in order to take into account the full-year data of the most recent acquisitions.
These actions are intended to drastically reduce greenhouse gas emissions despite forecasted business growth. In addition, Datwyler will engage in beyond-value-chain mitigation for emissions that continue to occur in order to achieve climate neutrality. Datwyler has also quantified the scope 3 emissions, mainly related to buying materials from suppliers for production and to upstream and downstream transportation by third parties.
Our long-term ambition
Climate-neutral operations (scope 1+2) by 2030 mainly based on a Science Based Targets (SBT) compatible reduction pathway.
Our future key targets
Annual reduction in absolute scope 1 and 2 emissions by 4.2% compared to 2023
ISO 14001 and ISO 50001 certificates at all production sites
Our approach
Ambitious commitment to climate target
Energy management at the production sites is part of the integrated Environmental Management System (EMS) and is part of the Datwyler Production System. A global Sustainability Manager coordinates the energy management reporting across all sites and is supported by a dedicated EHS officer at each individual site.
Datwyler commits to a far-reaching climate target for its operations: climate-neutral operations by 2030. The SBTi offers a 1.5°C reduction pathway to calculate Datwyler’s «fair share» in reducing carbon emissions in order to help achieve the 1.5°C level. The overall reduction pathway offers Datwyler a basis on the reductions needed to reach this goal by 2030 and beyond.
Determining the specific investments needed to achieve greater energy efficiency is one focus of the implementation program. In 2023, most European sites conducted an energy audit with a third party to increase energy efficiency. There were several potential energy saving measures identified and the sites will now evaluate the feasibility of the suggested measures. Purchasing renewable energy and the self-generation of electricity will be a main contribution to achieving our goals. Datwyler’s electricity consumption was more than 75% in 2023 of its overall energy consumption. By the end of 2022, already six sites had installed photovoltaic systems: Kesurdi in India, Montegaldella, Pregnana and Viadanica - all in Italy -, Schattdorf in Switzerland and Karslbad in Germany. In 2023, a photovoltaic system was installed in Daegu, Korea, and in Ningguo, China. Some of the sites that already installed PV panels in previous years began an expansion in 2023.
To ensure that we achieve our targets, we have started to proactively forecast our emissions for the next few years up to 2030. For this reason, each site prepared an overview of their current status and future plans for renewable energy, energy saving measures, etc. in 2023. On group level, the consolidated overview was used to identify gaps between the forecast and the target according to SBTi 1.5° and to define measures. To raise awareness at each site, quarterly CO2 emissions meetings were held with all Chief Operating Officers, Business Unit leads, and site directors, where actual and forecast emissions were presented, but also some trainings were provided, e.g. on the procurement of electricity from renewable energy sources.
_____
Further investments in PV systems and the extensions of contracts to procure renewable electricity increased the share of electricity from renewable sources to 38.3%. The drop in 2022 was due to the acquisitions of QSR and Xinhui. By integrating the newly acquired sites into Datwyler's sustainability strategy and targets, the share of electricity from renewable sources increased again in 2023.
Video content
This website uses no cookies by default and hides content which requires cookies to be displayed. If you want to see content like this you have to allow third party cookies. Read more about cookies in our Privacy policy.
The main goal is to reduce greenhouse gas emissions as much as possible by 2030. Datwyler will engage in beyond-value-chain mitigation for emissions that continue to occur. We are aware that the greenhouse gas emissions outside our operations—so-called scope 3 emissions—exceed the greenhouse gas emissions of our own operations. Our scope 3 emissions are described in the chapter Sustainable supply chain.
Datwyler has been recording the energy consumption and greenhouse gas emissions caused by its own operations for many years. The results of the last five years are shown in the accompanying table.
The five-year track record reveals an increase in energy consumption mainly resulting from business growth, new sites and acquisitions.
In 2023, Datwyler’s operations were responsible for emissions of about 90'116 tons CO2eq (scope 1 and 2), which results in a decrease of 0.4% compared to 2022. Relative CO2eq emissions have decreased by 0.48%. Looking at currency-adjusted net revenue for 2023 using the previous year's exchange rates, we were able to reduce relative emissions by 4.8% thanks to the measures implemented to improve energy efficiency and the switch to renewable electricity.
The sites in Schattdorf and Sao Leopoldo have been using renewable electricity since 2012 and 2016, respectively. In 2020, two sites , Alken and Vandalia, transitioned to renewable electricity. In 2021, four more—Pregnana, Montegaldella, Viadanica, and Karlsbad-Ittersbach—switched to renewable electricity. The site in Novy Bydzov has been purchasing renewable electricity since 2022. The site in Dongguan purchased renewable electricity for the full year 2023 and Pennsauken since December 2023. In 2023, 38.3% of Datwyler’s total electricity consumption at all sites came from renewable energy sources. The increase in the share of renewable electricity compared to 2022 is not as high, as some major energy-saving measures have been implemented at sites that already source electricity from renewable energies.
5-year comparison of energy consumption
2019
2020
2021
2022
2023
Total energy (MWh)
243'343
247'079
267'876
308'934
318'114
of which renewable sources (MWh)
25'731
39'610
79'117
90'856
97'761
Proportion of renewable sources
10.6 %
16.0 %
29.5 %
29.4 %
30.7 %
Total energy per net revenue (MWh/CHF millions)
265.8
296.2
282.7
268.5
276.3
Heating fuels (MWh)
42'272
60'387
64'001
66'220
67'420
Heating fuels per net revenue (MWh/CHF millions)
46.2
72.4
67.5
57.6
58.5
Overview electricity + district heating (MWh)
201'057
186'692
203'848
242'714
250'694
Of which electricity (MWh)
197'036
183'109
199'959
239'507
247'690
of which renewable sources (MWh)
22'182
36'162
75'375
87'729
94'794
Proportion of renewable sources
11.3 %
19.7 %
37.7 %
36.6 %
38.3 %
Electricity per net revenue (MWh/CHF millions)
215.2
219.5
211.0
208.2
215.1
Of which district heating (MWh)
4'021
3'583
3'889
3'207
3'004
of which renewable sources (MWh)
3'535
3'448
3'715
3'127
2'967
Proportion of renewable sources
87.9 %
96.2 %
95.5 %
97.5 %
98.8 %
Net revenue (CHF millions)
915.6
834.1
947.6
1'150.6
1'151.5
For the reporting of energy consumption, all 27 production sites are included in 2023. Locations where only office activities take place were excluded due to their low impact. For newly acquired companies, energy consumption was included in the first full calendar year until 2021. Accordingly, the energy consumption of the acquired companies Parco (USA) and Bins (Brazil) was included for the first time in 2019, as well as Middletown (USA) in 2020. Since 2022, the newly acquired companies are included right after the successful acquisition. The energy consumption of the acquired company Xinhui (China) was included for the first time in March 2022 and QSR (USA, Mexico and China) in May 2022. The increase in absolute energy consumption is due to the organic growth at existing sites and due to the acquisitions of QSR and Xinhui. Looking at currency-adjusted net revenue for 2023 using the previous year's exchange rates, we were able to reduce total energy per net revenue by 1.6%, heating fuels per net revenue by 2.7% and electricity per net revenue by 1.1%, all compared to 2022.
5-year comparison of greenhouse gas emissions (CO2eq)
2019
2020
2021
2022
2023
Total scope 1 and 2 (market-based) emissions (tons)
88'704
80'159
78'155
90'478
90'1165
of which scope 11 (tons)
8'798
12'509
13'285
13'798
13'8195
of which scope 22 - market-based (tons)
79'906
67'650
64'870
76'680
76'2975
of which scope 2 - location-based (tons)
–
–
80'419
94'901
101'9055
Total emissions per net revenue3 (tons/CHF millions)
96.9
96.1
82.5
78.6
78.35
Biogenic emissions4 - outside of scopes tons
1'238
1'207
1'300
1'094
1'0385
Net revenue (CHF millions)
915.6
834.1
947.6
1'150.6
1'151.55
____
For the reporting of CO2eq emissions, all 27 production sites are included in 2023. Consolidating GHG emissions is based on the operational control approach. Locations where only office activities take place were excluded due to their low impact. For newly acquired companies, CO2eq emissions were included in the first full calendar year until 2021. Accordingly, the CO2eq emissions of the acquired companies Parco (USA) and Bins (Brazil) were included for the first time in 2019, as well as Middletown (USA) in 2020. Since 2022, the newly acquired companies are included right after the successful acquisition. The CO2eq emissions of the acquired company Xinhui (China) were included for the first time in March 2022 and QSR (USA, Mexico and China) in May 2022. The greenhouse gas inventory was calculated in line with WRI/WBCSD Greenhouse Gas Protocol guidelines. Scope 1: GHG emissions from combustibles. Emission factor used: DEFRA. Scope 2: GHG emissions arising from the production of electricity and district heating purchased by the companies. Emissions factors used: IEA and EPA eGRID. Datwyler has defined 2023 as the base year in order to take into account the full-year data of the most recent acquisitions.
GHG emissions reported in scope 1 are from stationary (non-transport) combustion of fossil fuels at the facilities (e.g. boilers, turbines, process heat). Direct GHG emissions associated with fuel combustion from mobiles sources (fleet), process-related emissions, and direct fugitive emissions from refrigeration / air conditioning are excluded due to a lack of data and limited materiality. These will be assessed in the future.
Results in the table stem from a ‘market-based approach’ where for 10 sites with 100% renewable electricity, the emissions factors reflect emissions from electricity that sites have purposefully chosen (contractual agreements with electricity providers) and for the rest of the sites the national grid emission factors were used. Under sole consideration of the ‘location-based approach’ (using national grid emission factors for all sites), greenhouse gas emissions associated with the production of electricity would account for 101'905 t CO2eq in 2023.
The GHG intensity ratio is based on scope 1 and scope 2 (market-based) emissions per net revenue, as this is the best available approximation of the development of production output. Looking at currency-adjusted net revenue for 2023 using the previous year's exchange rates, we were able to reduce total emissions per net revenue by 4.8% compared to 2022.
Biogenic emissions reported stem from district heating at the site in Switzerland, which obtains process and heating energy from a nearby wood-fired heating plant, and take into account the direct carbon dioxide (CO2) impact of burning biomass, assuming 100% conversion of the energy burned. The corresponding methane (CH4) and nitrous oxide (N2O) emissions are reported in Scope 2 as of 2023.
Applying the highest quality standards during product development while striving for the utmost reliability and security are paramount to Datwyler’s success. This is reflected in the corporate value of «We excel in what we do». At the same time, the company must stay on top of future-oriented technologies, particularly regarding environmentally-friendly alternatives to the status quo. The concept of eco-design is hence moving to the forefront of Datwyler’s product development strategy.
Our focus
Datwyler’s quality management is based on internationally recognized quality and safety assurance systems, proactive chemical compliance, and innovative collaborations with higher education institutions, international standardization committees, and independent testing bodies.
The company believes that the concept of eco-design must be part of a holistic approach to quality product development that considers environmental, social, and economic benefits throughout the life cycle of products.
Our long-term ambition
Eco-design is integrated in all new product developments.
Future key targets
Product carbon footprint available for each new product.
Our approach
Datwyler continuously invests in even better materials, process technologies, production equipment, and testing methods.
Quality assurance through standardized processes
Datwyler’s quality management system processes are compliant with internationally recognized quality management standards. For example, sites making products for the automotive industry are certified to IATF 16949:2016, while Healthcare sites have ISO 9001:2015 and/or ISO 15378:2017 certification.
State-of-the-art clean room technologies paired with automatic camera inspections, among other systems, ensure impeccable quality for Datwyler’s over 300 billion manufactured components. In addition, the impacts of its products on user health and safety are closely examined.
Statutory information obligations as minimum standards
Raw materials, and therefore substances used across the material portfolio, go through a very accurate and rigorous selection process when it comes to new developments. All substances are subject to the highest levels of chemical regulatory compliance and are discarded in new developments based on their properties if dangerous to the environment or worker health.
With its proactive chemical compliance management, Datwyler goes above and beyond legal requirements. In its effort to proactively address critical substances, internally called "SoCs" (Substances of Concern), Datwyler is further engaging in analytical testing of finished products to determine if a full replacement is needed. This is also a commitment to its customers, to be able to produce clearer and more accurate statements that can help the entire supply chain.
Integration of eco-design in development and production
Eco-design principles offer a critical perspective when developing products that reduce the environmental impact across all its life cycle stages. Datwyler’s successful approach to eco-design optimizes the environmental performance of its products while also maintaining their functional qualities. This includes developing environmentally friendly elastomer compounds, optimizing design to save on materials, reducing process-related waste, and using reusable or recyclable packaging and boxes. But eco-design is more than simply reducing the environmental footprint of a product: this holistic approach helps developers think through social benefits and reconsider economic factors at the same time.
Datwyler successfully implemented the «Idea Box» tool where ideas and initiatives from employees have been selected from a development team to initiate concrete projects aimed at minimizing the ecological impact in different areas. For example, the platform has collected innovative ideas from several employees proposing to explore materials that reduce the carbon footprint of our products. These proposals were evaluated and discussed by a group of internal experts. The ideas have been acted upon based on recommendations from experts, ensuring alignment with our strategic objectives.
Datwyler has implemented the "eco-design checkboxes" for both "build-to-print" and "co-engineering" product development. With this new tool we will be able to provide an estimation of the cradle-to-gate product emissions already at the RFQ level. This will allow early identification of potential critical points and, together with our experts, we will develop strategies to reduce emissions while ensuring functionality and high-quality products. This will be a great asset to help create more opportunities and offer new solutions to support the common goal of reducing emissions.
Pilot projects on Product Carbon Footprint (PCF) and Life Cycle Assessments (LCA) have been conducted for typical products in both Mobility and Healthcare businesses. The studies revealed the great impact arising from the materials, making it clear that more urgent efforts are needed to find concrete solutions, where chemical compliance and safe workplaces are always taken into account in the overall equation of reducing emissions and impact.
Datwyler and its employees' strong commitment to eco-design provides added value for its customers by promoting and supporting common sustainability goals.
Datwyler systematically integrates eco-design into the product development process. In this way, the company creates value for its customers and promotes sustainability.
Sustainability also considered as criteria in new material developments
Material development is an area in which Datwyler has the most control over new materials. Researching new materials not only involves assessing the cost, manufacture, and performance of the final product, but also its environmental impact, from the sustainability of the raw materials to the compostability and overall recyclability of the component.
Datwyler is currently working on a number of projects that could reduce the need for fossil fuels in the elastomer manufacturing process. These projects include replacing an oil-based polymer with a polymer made from sugar cane, using a plasticizer based on vegetables rather than petroleum oil, replacing plastic-based fibers with modified cellulose, and many more.
The use of recycled materials is another important area for sustainability, and we have been investigating how scrap material produced during manufacture can be used in brand new components. The process involves grinding leftover material down to a fine powder, which is then added to the raw materials for new components. Not only does this reduce the volume of discarded material in the original process, but it also increases the amount of reclaimed materials in new products.
Focus topic
Resource-friendly production
Datwyler’s corporate values and the Datwyler Code of Conduct highlight the company’s commitment to the responsible handling of natural resources. In fulfilling its promise to be a responsible and sustainable company, Datwyler not only improves sustainability awareness but also gains a competitive advantage by attracting new customers. To uphold these goals, Datwyler has a vested interest in developing more resource-friendly production methods, such as reducing process-related elastomer waste through improvements in production processes and component engineering.
Our focus
Resource consumption in production is one of Datwyler’s focus topics, as it is a primary lever for reducing its environmental impact. We also recognize the importance of biodiversity and the link between water consumption, waste, and the release of greenhouse gases to the loss of biodiversity. Our corporate goals relating to resource-friendly production contribute to the protection of biodiversity. The impact of Datwyler on biodiversity, either directly via sites that are located near biodiversity-sensitive areas or indirectly via the impact of activities and products on biodiversity were not yet assessed, but we will explore the possibility of reporting on this in more detail in the future.
Datwyler’s priority is the gradual reduction of waste and water consumption, in addition to improved energy efficiency and increased use of renewable energies. Energy- and emission-related activities are reported in the focus topic Climate-neutral operations 2030.
Our long-term ambition
Low-waste and highly water-efficient production.
Future key targets
Reduce water consumption relative to net revenue by 3% per year
Reduce waste volume relative to net revenue by 3% per year
ISO 14001 certificate at all production sites
Our approach
Datwyler Production System (DPS)
The Datwyler Production System, which is based on the company values and lean principles that guide Datwyler employees, is a long-term improvement program to foster a lean and agile culture and achieve operational excellence in both manufacturing and non-manufacturing areas. As a shared program for continuous improvement, this system supports uniform production processes across all sites on all continents. For Datwyler, the quest for operational excellence means not only a safe workplace, high-quality products, on-time deliveries, and satisfied and empowered employees, but waste-free processes and environmental protection as well. This makes reducing the consumption of resources and protecting the environment an integral dimension in the pursuit of operational excellence.
Environmental Management System (EMS)
Within the Datwyler Production System, a certified and integrated Environmental Management System (EMS) provides the basis for optimizing resource use. This EMS aims to minimize the impact of the company’s operations and products on the environment by designing and manufacturing products and processes that use natural resources sustainably and reduce the company’s carbon footprint. A global sustainability manager reports on the environmental management across all sites and is supported by site EHS officers.
In addition, the impact on resource use is also considered when the Group embarks on maintenance or modernization of its worldwide production sites.
As a result of the EMS, seventeen of Datwyler’s sites have already achieved environmental certification in accordance with the ISO 14001 standard and other sites are laying the groundwork to achieve this certification. The Swiss site is also a member of the Energy Agency of the Swiss Private Sector (EnAW).
Water withdrawal
Most of Datwyler's total water withdrawal is attributable to the specific requirements of its production processes. Both the cooling systems used in the Food & Beverage business unit's production and the washing of components in the Healthcare sector require significant amounts of water. Specifically, approximately 30% of Group-wide water withdrawal occurs due to the groundwater cooling system used in Switzerland. Since this is a closed-loop system at our production site, the groundwater withdrawal in Switzerland is reported separately.
The long-term target (2015 to 2025) is to reduce relative water withdrawal per net revenue unit by 3% each year. In 2023, the absolute water withdrawal was higher than in the previous year. While most of our sites managed to decrease absolute water withdrawal by a large amount, there was a reporting error at some of the newly acquired sites in 2022. They either reported water withdrawal in the wrong measurement unit or did not report the water withdrawal from all sources. These errors were corrected in the 2023 analysis.
Even more informative than absolute water withdrawal is water withdrawal in relation to net revenue—the best approximation of the development of production output. This observation shows the development of efficiency in water use. Due to the errors mentioned before, water withdrawal per net revenue has increased by 7.4%.
5-year comparison of water withdrawal
2019
2020
2021
2022
2023
Groundwater cooling system1 (m³)
672'204
828'087
913'404
1'057'769
747'230
Drinking/industrial water (m³)
1'901'289
1'564'028
1’523’875
1'657'848
1'782'699
Water per net revenue (m³/CHF millions)
2'076.5
1'875.1
1’608.1
1'440.9
1'548.2
Net revenue (CHF millions)
915.6
834.1
947.6
1'150.6
1'151.5
For the reporting of water withdrawal, all 27 production sites are included in 2023. Locations where only office activities take place were excluded due to their low impact. For newly acquired companies, water consumption was included in the first full calendar year until 2021. Accordingly, the water consumption of the acquired companies Parco (USA) and Bins (Brazil) was included for the first time in 2019, as well as Middletown (USA) in 2020. Since 2022, the newly acquired companies are included right after the successful acquisition. The water consumption of the acquired company Xinhui (China) was included for the first time in March 2022 and QSR (USA, Mexico and China) in May 2022. The increase in absolute water withdrawal is due to a reporting error in 2022.
Groundwater withdrawal in Switzerland for the groundwater cooling system. Since this is a closed-loop system at our production site, it is reported separately and is not included in either the "Dringing/industrial water" line or the"Water per net revenue" line.
Waste disposal
The EMS system also supported Datwyler in setting a goal to reduce the volume of waste in relation to net revenue (tons/CHF million) by 3% annually. Datwyler has succeeded in increasing the amount of elastomer waste used in downcycled products steadily over the past five years. For example, the company’s process-related elastomer waste is increasingly used in the production of surface coverings for sports fields. With this application, Datwyler increased the amount of recycled and reused waste from 68.3% in 2017 to 71.9% in 2023.
The absolute volume of waste increased by 4% from 20'656 tons in 2022 to 21'488 tons in 2023. This increase is mainly due to the acquisitions of QSR and Xinhui. As mentioned in the 2022 report, the accuracy of the waste reporting at the newly acquired companies QSR and Xinhui was not entirely given in the 2022 reporting, but it was presented as transparently as possible. As part of the post-merger integration, the accuracy of their waste reporting could be improved, leading to higher numbers. With an increase of waste per net revenue of 3.9% (reduction of 0.5% when looking at currency-adjusted net revenue for 2023), the target of a 3% reduction could not be reached. One of the measures for 2024 is to better understand our waste streams, assess the volume by different categories, and identify the greatest potential for improvement to ensure that the target is achieved next year.
5-year comparison of waste disposal
2019
2020
2021
2022
2023
Total waste (tons)
14'298
14'119
17'205
20'656
21'488
of which regular waste (tons)
13'410
13'361
16'435
19'617
20'514
of which hazardous waste (tons)
888
758
770
1'039
974
of which recycling / reuse (tons)
10'309
10'253
12'750
14'452
15'440
of which incinerators / landfill (tons)
3'989
3'866
4'455
6'204
6'048
Proportion of waste sent for recycling or reuse
72.1 %
72.6 %
74.1 %
70.0 %
71.9 %
Total waste per net revenue (tons/CHF millions)
15.6
16.9
18.2
18.0
18.7
Net revenue (CHF millions)
915.6
834.1
947.6
1'150.6
1'151.5
For the reporting of waste volume, all 27 production sites are included in 2023. Locations where only office activities take place were excluded due to their low impact. For newly acquired companies, waste volume was included in the first full calendar year until 2021. Accordingly, the waste volume of the acquired companies Parco (USA) and Bins (Brazil) was included for the first time in 2019, as well as Middletown (USA) in 2020. Since 2022, the newly acquired companies are included right after the successful acquisition. The waste volume of the acquired company Xinhui (China) was included for the first time in March 2022 and QSR (USA, Mexico and China) in May 2022. The increase in absolute waste volume is due to the organic growth at existing sites and due to the acquisitions of QSR and Xinhui. Looking at currency-adjusted net revenue for 2023 using the previous year's exchange rates, we were able to reduce total waste per net revenue by 0.5% compared to 2022. Further, as part of the post-merger integration, the accuracy of the waste reporting at the acquired sites could be improved, leading to higher numbers.
Focus topic
Sustainable supply chain
Datwyler prioritizes using quality raw materials to improve its competitive position and guarantee business continuity. Knowing that a socially and environmentally sustainable supply chain is the basis of its sustainable solutions, the company integrates sustainability in the selection and monitoring of its suppliers, seeks long-term supplier relationships, and actively collaborates with its supply chain to stimulate greener products and ideas. Furthering the sustainability of suppliers also supports the advancement of Datwyler’s other focus topics, such as resource-friendly production and eco-design.
Our focus
The purpose of Datwyler’s procurement function is to bring innovative and sustainable solutions into the company and to strive for local-for-local sourcing, while maintaining focus on cost optimization, availability of raw materials, proactive risk management, and compliance. Datwyler continually works to reduce packaging material and source the most environmentally friendly raw materials possible in order to reduce the environmental footprint of its end products.
A binding Code of Conduct for suppliers and guidelines for sustainable procurement form the basis for ethical and environmentally friendly supply chains. In addition, by systematically embedding ESG criteria into its procurement processes, Datwyler strives to continuously increase the sustainability level of the company’s suppliers. Datwyler's procurement activities focus primarily on suppliers of quality-critical raw materials and products as well as on particularly important suppliers.
Our long-term ambition
Further improve ESG-compliant processes and supply chain and bring in sustainability solutions through our supplier base.
Future key targets
Strive for all quality-critical suppliers to sign Supplier Code of Conduct
Annual increase of the ESG maturity level of our supplier base
Motivate suppliers to bring in more sustainable solutions
Ensure availability of the most important raw materials through pro-active risk management. This includes, among others local-for-local and whenever possible dual sourcing of materials
In sourcing, identify five product replacements with better sustainability performance annually by 2030
Further development of risk management, focusing on both supply chain risks and sustainability risks
Our approach
Global standardized guidelines and supplier management processes
Datwyler produces system-critical components that mainly consist of elastomer. Hence, the company primarily buys raw materials such as elastomer materials, plastics, aluminum, metals, and operating supplies. To procure these raw materials, the company works with approximately 400 suppliers worldwide, with about one-third of the purchasing volume sourced from the ten largest suppliers. Approximately 65% of raw materials come from Europe, while 20% and 15% come from Asia and the Americas, respectively.
Datwyler’s Global Procurement Team takes pride in its versatility and various fields of expertise. It provides local procurement teams at each site with global standardized guidelines and supplier management processes.
The broad and proven supplier base and the well-established processes prove their worth, especially when faced with ongoing material shortages, site closures, force majeure, etc. These challenges do not affect our ability to supply our customers. Despite these additional efforts in procurement, Datwyler continued to drive forward the further development of the sustainability level of its suppliers, which was launched in 2020:
Integrating ESG into supplier selection and monitoring practices
Integrating ESG topics into supplier audits
Encouraging suppliers to suggest more sustainable products and share ideas
Exchanging ideas with suppliers and learning from them
Embedding ESG to improve supply chain sustainability
Selection
Datwyler’s standard Code of Conduct for suppliers forms the basis for its ethical and environmentally friendly supply chains. One of Datwyler’s goals is to strive for all quality-critical suppliers to sign the Code or present equivalent internal guidelines, and a 2023 analysis revealed that 96%1 of the quality-critical suppliers were already meeting this requirement. In addition, suppliers must be in compliance with certain ISO norms.
Datwyler developed its own Supplier Sustainability Assessment program, which is used to monitor the ESG performance of its most important suppliers. In 2023, 65 suppliers were assessed. The program awards points for:
signing Datwyler’s Supplier Code of Conduct
sustainability certificates (ISO 14001, ISO 45001, ISO 50001)
quality sustainability reporting (toward GRI, disclosing of energy and water footprints and work-related incidents)
tier-1 suppliers that have a Supplier Code of Conduct for their supplier base
a defined position responsible for sustainability
In 2023, the most important suppliers scored 80%1 of available points (previous year: 71%).
Each quarter, the status of all available supplier certificates is reviewed and updated. Currently, 46%1of our quality-critical suppliers are certified according to ISO 14001 (previous year: 43%), 16%1 according to ISO 45001 (previous year: 16%), and 15%1 according to ISO 50001 (previous year: 13%). These three certificates are proof that suppliers have a systematic approach to the topics environment, health & safety, and energy. As a customer, we can rely on the efficiency of the systems implemented as they are audited externally.
Auditing
Relevant ESG-related ISO norms are also included in all on-site audits.
Complaint management
Datwyler has a quality complaint management process in which also possible environmental and safety related impacts are being monitored and reported.
Training procurement teams
To ensure that the newest guidelines are met, Datwyler provides annual training for its purchasers. In 2023, refresher training sessions for the purchasing employees were conducted to challenge suppliers in order to strengthen the collaboration and to support Datwyler's sustainability goals.
Facilitating sustainable solutions through supply chain engagement
Encouraging more sustainable product offerings
The company also began encouraging suppliers to propose more sustainable materials to replace existing products completely or to be used in new developments. Several suggestions have been received already, and the goal is to identify five product replacements annually by 2030. In 2023, we gathered 10 ideas from suppliers that are currently being reviewed by Datwyler.
Promoting local sourcing
To support its eco-design priority, Datwyler aims to increase its share of locally sourced materials. After identifying the number of existing local suppliers, packaging materials was selected as a first focus and local sourcing targets were developed. This approach is now also being extended to raw materials and indirect materials. This strategy will also reduce the company’s supply chain continuity risks.
Reducing product and service footprints
Datwyler has set a goal to collaborate with suppliers on at least one project a year that targets the reduction of the carbon footprint of a product or service. Some suppliers have already evaluated the footprint of their products and services, and Datwyler would like to have at least one active project per year from 2021 onward. Recently, we approved a 100% recycled plastic box for our first-line products packaging in the Healthcare department. As part of the scope 3 analysis, the further focus for the next projects with suppliers will be defined.
Proactive reduction of packaging material
Datwyler takes action at various levels to reduce the environmental impact of raw material procurement. Whenever practical and possible, the company has raw materials delivered in large volumes by dry-bulk tankers, which cuts down on packaging materials significantly.
About a third of raw materials are delivered in boxes on pallets, which suppliers reclaim and reuse. Non-reusable pallets and boxes comprised of wood, cardboard, or plastic are recycled via disposal companies.
Striving for environmentally friendly materials
Datwyler is constantly looking for the most environmentally friendly raw materials possible. To this end, the procurement department works with the technology and innovation department to implement the findings of proactive chemical compliance management.
Recognizing that synthetically produced rubber derived from crude oil has a considerable carbon footprint, Datwyler is currently exploring the option of a synthetic rubber based on monomers derived from plants. In the Food & Beverage business unit, Datwyler, as an innovative partner, is supporting Nespresso to move toward sustainable and traceable aluminum in the spirit of the circular economy.
Supply risk management
In 2023, Datwyler started to implement a structured supply risk management process. Based on mitigation actions already taken in recent years, risks are being mapped to create more transparency about the current status. Dual sources are being identified to further mitigate supply risks, but also to reduce commercial dependencies. During the selection of new materials and suppliers, Datwyler wants to identify possible risks pro-actively and whenever required, mitigate them. Market intelligence should also enable possible risks to be identified in an early phase.
Scope 3 analysis
Datwyler identified and quantified its scope 3 emissions, such as in the procurement of materials for production, for the first time in 2023. We screened all 15 scope 3 categories, but came to the conclusion that not all of them are relevant for Datwyler. For the calculation of the relevant categories, data from 2022 was used. For many of the categories, the state-of-the-art expenditure-based method was applied.
Datwyler's total scope 3 emissions are estimated to be approximately 250'000 metric tons CO2eq, with the largest category, purchased goods and services, accounting for around 85 percent of emissions.
Our scope 3 emissions are therefore responsible for at least 70% of our total emissions, demonstrating the importance of our supply and value chain engagement to reduce emissions. In the future, we will regularly publish the latest results on our scope 3 emissions. Future analysis may show an increase in our scope 3 emissions as we improve the completeness and accuracy of the data over the next few years.
Initiatives such as applying eco-design in product development help to identify measures to reduce scope 3 emissions in the future, such as by choosing low-carbon materials and reducing material consumption. Specific targets on scope 3 emission reduction are not currently set but will be developed step by step.
By focusing on social activities, Datwyler aims to deliver more value and meaningful purpose to its customers, employees, and communities.
Focus topic
Employer of choice
In order to excel in the fast changing global industrial landscape, a highly skilled and dedicated workforce is paramount. Our commitment at Datwyler to becoming an employer of choice goes hand in hand with our social responsibility, as we recognize the importance of attracting international talent.
We prioritize providing equitable, safe, and empowering work conditions within a diverse and dynamic environment. We strive to continuously improve and support our employees to become the best version of themselves.
Our focus
Datwyler aspires to empower its workforce to be catalysts of value for customers, the company, themselves, their local communities, and the broader planet. Our commitment to inclusivity and fairness extends to our dedication to fair treatment, and just employment conditions.
Central to our mission is the cultivation of talent and the nurturing of leadership. We place a strong emphasis on fostering agility and an entrepreneurial spirit in each and every employee.
Our long-term ambition
To collaborate as a diverse and inclusive network of ambassadors and contributors, enabling the company to stay on top of labor market trends and be a great place to work.
Future key targets
Employee commitment rate above industry benchmark for all sites
Strive for zero accidents, zero injuries, and a healthy working environment
ISO 45001 certificate at all production sites
Our approach
Composition of workforce
At the end of 2023, the headcount—including those on fixed-term contracts—totaled 8'178 people (previous year: 8'698). Employees are spread across more than 30 locations in 13 countries, with 38.6% in Asia, 25.4% in North and South America, and 36.0% in Europe. This equated to 8'056 full-time equivalents at the end of the year (previous year: 8'596).
Expressed as an annual average, 9.0% were employed on a fixed-term contract (previous year: 10.0%). The proportion of women in the overall workforce was 35.8% (previous year: 35.7%), while the proportion of women in senior positions was 19.9% (previous year: 19.4%). Based on 8'303 as the average number of full-time equivalents for the year (previous year: 8'104), net revenue per full-time equivalent was CHF 138'685 in 2023 (previous year: CHF 141'979).
Datwyler pays fair wages and offers social benefits in line with the relevant country and sector. Personnel expenses, including contributions to the social security funds, amounted to CHF 376.7 million in the reporting year (previous year: CHF 359.2 million).
Workers who are not employees and whose work is controlled by Datwyler are part of the temporary headcount reporting. In headcount-reporting Datwyler does not distinguish between employees on Datwyler contracts and those employed through third parties.
However, temporary staff are generally hired for functions such as operations and logistics through an employment agency and therefore do not have an employment contract with the Datwyler Group.
Some of the manufacturing locations rely on temporary staff during peak production periods, while other manufacturing locations, particularly in the USA, hire first through third parties and take on the best-performing employees on a permanent basis with Datwyler. The turnover of temporary employees is not tracked in detail.
Datwyler emphasizes fair and secure working conditions and an attractive, inclusive, and agile work environment for all its more than 8'000 employees.
Leadership and People Empowerment
Leadership and people empowerment is a core fundamental element in our journey to achieve operational excellence. We need a psychologically safe, trustful, and vital workplace where people can speak out, challenge the status quo, voice their ideas, and can work on those. We empower our employees day by day to make their valuable contribution to our shared ambition.
At Datwyler, we are aware that creating and sustaining a vital and high-performance workplace starts at the top. It takes deliberate effort to walk the talk so that teams not only know they are empowered, but also feel it and act upon it. That is why we engaged 90 people of our top leadership teams in workshops during our yearly group seminar in May 2023. In those interactive workshops, we addressed the fundamental themes of trust, psychological safety, workplace vitality, leadership paradoxes, and giving/receiving feedback.
Promoting entrepreneurial initiative through Objectives and Key Results (OKR approach)
At Datwyler, our management approach revolves around clear and inspiring objectives, broken down and allocated throughout the organizational hierarchy. We employ the Objectives and Key Results (OKR) framework for this purpose. Each objective is accompanied by a set of specific, time-bound, and challenging key results, with corresponding activities that drive focused action on what truly matters.
Per key result, one employee takes the lead in coordinating activities and engaging contributors. We encourage them to act as entrepreneurs and self-organize their work while striving for successful completion, and encourage particular talents from our talent pools to step forward as key results owners. Regular reviews, concrete feedback, and adjustments of these activities ensure that we stay on the right track.
For 2023, we prioritized the development of a digital mindset in our organization as one of the key results. It is inspiring to see the full team taking ownership to deliver on promise. They own the roadmap, decide on offerings, develop and deploy training courses as subject matter experts, communicate internally, and engage learners to benefit from their efforts. In 2023, more than 10 courses were completed by 400 subscribers.
Agility to strengthen competitiveness
Increasing agility is a strategic priority for Datwyler. This commitment drives the enhancement of the organization's ability to swiftly respond to evolving circumstances, while simultaneously fostering deeper collaboration across departmental boundaries and hierarchical tiers.
To facilitate this, we publish important projects on our internal marketplace within Datwyler’s intranet, detailing their purpose, project structure, and the skills we are looking for. This platform provides volunteers with an opportunity to apply and engage in cross-functional international teams in addition to their primary line organization responsibilities. For our volunteers, this dual role not only enriches their learning experiences, but also makes them more visible to top management, all while driving our business forward.
Leadership development/ WeLead program
In 2023, Datwyler continued its efforts in empowering others within our daily operations, enabling our employees to grow their talents, skills, and creativity. We do this by equipping our leaders with targeted training programs, enabling them to create a culture where every individual feels valued, respected, and recognized for their unique contributions.
At the heart of our approach is the WeLead program, a modular series of off-the-job training initiatives. Each module has its own set of learning objectives aimed at achieving distinct yet aligned outcomes. This program serves as the cornerstone of our learning and development strategy, enabling our leaders to apply the most relevant leadership styles in a VUCA (volatility, uncertainty, complexity, and ambiguity) world.
Throughout 2023, a total of 154 dedicated Datwyler employees actively participated in 11 WeLead training sessions. We asked for participants feedback through surveys. Their responses have been positive, highlighting the high level of interactivity and the varied delivery methods, which encompass input sessions, breakout group collaboration, plenary discussions, and personalized coaching. In particular, they appreciate the safe and supportive learning environment and possibility to expand their internal network.
In response to regional growth and increased demand and in addition to the global offering, Datwyler invested in on-site sessions in Germany, Czech Republic, and Brazil. We do so to further enhance the quality of our courses and deliver an impactful learning experience to our employees, in their preferred local language.
In 2023, we developed a new WeLead module together with our external training partner. This module will equip our leaders with more self-awareness and support them in building their skills relating to psychological safety, trust, non-violent communication, and giving and receiving feedback when we roll out the new module as of 2024.
Talent and succession management
In 2023, Datwyler reaffirmed its commitment to talent and succession management, building upon the framework introduced in 2020. We actively engaged top management and held more than 10 in-person conferences. We finetuned our talent pool setup so that it aligns with our new job grading system.
Our primary objective included conducting comprehensive assessments, identifying and providing guidance to talented individuals, essential for pivotal roles, thus strengthening our succession planning.
We consulted leaders on making qualitative individual development plans and on their role in following up on them. Further, we implemented consistent criteria by making use of verified and validated assessment methodologies such as Thomas International psychometric testing, and harmonized these practices with our diversity, equity, inclusion and belonging principles, effectively bridging the gap between local and global talent assessments. In specific cases, we held assessment days and development centers for internal and external candidates as part of their move into a next career step.
Furthermore, we have made substantial steps forward in the digitalization of our processes, ensuring ongoing enhancements in data quality in our HR information system. We now have more detailed employee profiles uploaded and available at hand during talent conferences. That allows us to review formal educational background, additional vocational training, history of work experience, language skills and so on while discussing talent and succession planning.
To empower our identified talents, we facilitate self-assessments, offer a 360 degree feedback tool, and craft personalized development plans, combining a blend of on-the-job and off-the-job activities to prepare them for forthcoming challenges. Additionally, we've introduced development centers tailored to nurture top-level managers, further strengthening our leadership pipeline.
Learning and development
Datwyler envisions becoming a self-learning organization and invites everyone to become the best version of their true self. Learning and development (L&D) plays a pivotal role in cultivating the culture and growth mindset necessary to achieve that vision. In 2023, Datwyler implemented their L&D strategy, which helps to focus and prioritize their actions. Shaping that self-learning organization together with our internal customers and partners has become the essence of the L&D strategy.
Our priorities for L&D are:
Refreshing and updating our leadership development program to build a sustainable leadership base
Partnering with key result owners to achieve their key results through L&D offerings
Deploying lean L&D processes and products
The Datwyler Academy is part of the learning and development strategy and our offering is growing step by step. Our employees have easy access to our Learning Management System (LMS platform) and are regularly informed about new course releases. In 2023, the LMS was a significant enabler of the digital mindset key result (see chapter Promoting entrepreneurial initiative through Objectives and Key Results (OKR approach).
In 2023, the number of active learners once again grew steadily and the number of courses doubled since last year. We achieved 25'000 course completions around the turn of the year, both on internal and external offerings published in our digital library. This includes, but is not limited to mandatory compliance training such as Code of Conduct and IT Security Awareness modules.
Our offering contains an effective mix of internally developed and externally purchased courses. Internal subject matter experts generate training material and support each other to raise the quality bar using peer review and feedback. We managed to create a community which shapes that self-learning organization together.
Performance management
Implementation of a global job architecture and job grading
One of the core tasks in the field of HR in 2023 dealt with the implementation of a global job architecture and job grading system. All Datwyler positions have been placed in a job that is graded based on international position evaluation methodology. Supported by an extensive communication and information plan, our HR team has been leading the change.
With the foundations laid in 2023, Datwyler’s global job architecture and job grading will serve as the foundation for globally consistent HR practices and standards. It is expected to enhance career path development, performance management, employee development initiatives, compensation practices and so on, going forward.
Reward team effort
In 2020, Datwyler redesigned its concept for the variable incentive. Individual goals were set aside and replaced by common corporate goals. This system was further improved in 2021. Starting from 2022 and continued also in 2023, sustainability targets have been included in the variable incentive. Employees have been continuously informed about the efforts, e.g. relating to the reduction of CO2eq, the accident severity rate and the Net Promoter Score measured in a survey, conducted bi-annually.
By taking sustainability measurement parameters into account in the variable incentive for more than 1’000 eligible employees, Datwyler is promoting awareness of the sustainability focus areas.
Personal performance appraisals support development
While individual targets for the award of variable remuneration are a thing of the past at Datwyler, individual targets remain in place to support the personal development of each employee. At least once a year, all leaders and employees engage in a structured dialog to discuss key tasks, Datwyler competences, and to agree on development opportunities both on and off the job.
Employee surveys
Employees who are happy, motivated, and willing to accept change are the backbone of a company because they work hard. They should make up a substantial proportion of the workforce. To measure employee satisfaction and engagement on a range of parameters, Datwyler regularly conducts a comprehensive employee survey, most recently in 2023 for the full group.
To safeguard confidentiality and anonymity while surveying the employees around the globe, Datwyler works in partnership with icommit, which has employee surveying as its core business.
In 2023, we achieved 81% participation rate for the global employee base. All sites and both permanent and temporary employees were invited to take part in the survey. We ran our survey fully digitally so that we could work more sustainably than ever before while shortening the reporting timeline. We published the results in a digital reporting platform, which at the same time serves as a continuous action planning and follow-up tool. All sites were encouraged and supported in disseminating the results in their organizations and empowering local volunteers to collaborate in improvement activities. Some examples of such follow-up initiatives are: improve the Tier structure of Datwyler Production System (DPS) so that we engage more employees on-site; work on internal communication so that we include everyone and make sure relevant information reaches all; further digitalize and publish internal structures and procedures so that these are easy to find at all times.
One key outcome of this survey was the commitment rate, which serves as a component for the variable incentive. To calculate the employee commitment rate, the following statements were used:
I'm satisfied with what I achieve in my work and I always strive to make improvements
I feel a strong sense of belonging to this company
I really care about the future of this company
Employees had to reply to what extent they agree with the statement, resulting in a score of 0 to 100. The overall commitment rate was then calculated as the average of the results of the three statements.
In 2023, we were pleased to have achieved a score of 851 (out of 100), maintaining our score of the previous survey in 2020 and exceeding the industry benchmark score of 82. The industry benchmark is defined by icommit and consists of 26 groups in the industry international sector.
The slogan #FOR YOU serves as an umbrella for a range of benefits and initiatives at Datwyler that support employees and make them feel valued. The program is constantly growing and organized around five pillars:
Health
Well-being
Work environment
Ideas/involvement
Personal development
Throughout 2023, Datwyler received and assessed bottom-up ideas that were submitted via our innovation platform. One of those ideas dealt with the creation of a human library as a great way to share the knowledge and insights of our employees with the rest of the company. Meanwhile, our Datwyler Human Library is live as a podcast interview series in our Learning Management System (LMS). These interviews aren't just about successes, but also the lessons learned from challenges and setbacks. They serve as a testament to our community's strength.
Employee structure
2023
2022
Change
Headcount annual average
8'431
8'191
+2.9 %
thereof female
35.8 %
35.7 %
n/a
Average permanent headcount
7'674
7'371
+4.1 %
thereof female
36.7 %
36.9 %
n/a
Average temporary headcount
757
820
–7.7 %
Average full-time headcount
7'441
7'145
+4.1 %
thereof female
36.2 %
36.2 %
n/a
Average part-time headcount
208
205
+1.5 %
thereof female
58.2 %
62.4 %
n/a
Average headcount with higher management function
256
227
+12.8 %
thereof female
19.9 %
19.4 %
n/a
Headcount end of period
8'178
8'698
-6.0 %
Employees joining (new, growth in existing functions/replacements)
1'530
1'271
+20.4 %
Employees leaving
2'050
1'348
+52.1 %
thereof voluntary leaves
1'491
1'129
+32.1 %
Rate of new hires
19.9 %
17.2 %
n/a
Turnover rate
19.4 %
15.3 %
n/a
The turnover rate is calculated by dividing the number of those leaving voluntarily by the average headcount for the year (not including temporary employment contracts).
Voluntary leaves
2023
2022
Change
Male
875
635
+37.8 %
turnover rate
18.0 %
13.6 %
n/a
Female
616
494
+24.7 %
turnover rate
21.9 %
18.2 %
n/a
Under 30
683
407
+67.8 %
30-50
717
603
+18.9 %
Over 50
91
119
–23.5 %
Higher management (mgmt)
13
24
–45.8 %
Team leader (tl)
8
8
+0.0 %
Office worker (excl. mgmt & tl)
125
126
–0.8 %
Production worker (excl. mgmt & tl)
1'345
971
+38.5 %
Full-time equivalents average YTD
8'303
8'104
+2.5 %
Full-time equivalents
2023
2022
Change
Full-time equivalents end of period
8'056
8'596
–6.3 %
thereof in Asia
38.6 %
38.7 %
n/a
thereof in North and South America
25.4 %
26.1 %
n/a
thereof in Switzerland
7.1 %
7.0 %
n/a
thereof in rest of Europe
28.9 %
28.2 %
n/a
Established health and safety management
Datwyler is committed to protect the health and safety of all employees, temporary workers, contractors, or visitors by planning, managing, conducting, and supervising its work in compliance with legislation and best practices. One priority of Datwyler’s health and safety management is to develop and coordinate health and safety systems and processes to prevent accidents and improve health and safety conditions for everyone present at our sites. To reinforce this ambition, Datwyler established a global objective to further reduce the number of accidents with human impact throughout the organization. A taskforce coordinates global workplace safety and health initiatives in partnership with Human Resource Management. Intercompany initiatives and support are encouraged by this team to strengthen the health and safety knowledge, and to share the practical implementation of actions and processes.
Improving our results will only be successful if all our internal and external colleagues are striving for the highest level of safety awareness. To achieve this, the sites are encouraged to organize trainings, to perform regular internal and external audits, and to encourage employees to report any safety observations. Sharing this information between sites will be more visible in the near future. Datwyler is committed to certify all sites according to the safety standard ISO 45001. These certification audits ensure health and safety compliance, good practices, increased safety awareness, and continuous improvement. Already nine sites are ISO 45001 certified. As these nine sites comprise more than half of Datwyler’s employees, they are inspirational in increasing safety awareness for all our Datwyler colleagues worldwide.
In the production sites of the two business areas Healthcare Solutions and Industrial Solutions, there were 1'668 days of absence due to workplace accidents in 2023 (prior year: 1'319). A workplace accident is defined as an event occurring in the professional environment which results in an injury, occupational illness, or fatality of an employee (including temporary workers), while taking local regulatory definitions into account. Datwyler uses the accident severity rate as KPI, which is defined as days of absence due to workplace accidents divided by total hours worked multiplied by 1'000. This figure equates to 0.10 for 2023 (prior year: 0.09). The result shows that further attention is needed. One measure is that in future there will be closer cooperation between the task force and the EHS managers at the sites to analyze and discuss accidents and serious safety problems in order to prevent them from occurring at other sites.
Higher than accident-related absence is absence due to illness. This amounted to 48'508 days in the reporting year (prior year: 48'340). This equates to 5.84 days of illness per full-time equivalent (prior year: 6.37). This value is above the medium-term Datwyler target of four days of absence due to illness a year per full-time equivalent.
The data for accidents and illness includes both permanent and temporary employees and covers all sites. Datwyler is employing systematic absence management and individual consultations to continuously work on further improvement of the work environment aiming to reduce the absence rate and keep employee motivation high.
Employee health and safety is a top priority for Datwyler. Regular training sessions and audits are held, and lessons learned are shared across all sites.
Absences
2023
2022
Change
Total available working days FTE (TAWD)
2'204'351
1'946'404
+13.3 %
Total absences other than vacation days
77'724
83’978
–7.4 %
Total absences other than vacation days in % of TAWD
3.5 %
4.3 %
n/a
thereof absences due to work related accidents (days)
1'668
1'319
+26.5 %
Work-related accidents in days per FTE (annual average)
0.20
0.17
+15.7 %
Accident severity rate (annual average)
0.101
0.09
+10.1 %
thereof absences due to illness (days)
48'508
48'340
+0.3 %
Illness in days per FTE (annual average)
5.84
6.37
–8.2 %
FTE = Full time equivalent. TAWD = Total available working days.
The needs and requirements of customers are at the heart of everything Datwyler does. The only way a business can enjoy sustainable success is to make sure its customers are completely satisfied. Two of our corporate values—«We are entrepreneurs» and «We bring value to our customers»—speak to the importance of this perspective.
Customer retention takes more than just high-quality customer service. Datwyler truly values its relationship with customers, designing its products and solutions to not only fulfill the highest expectations in terms of functionality and quality but to also do their part to support the customers’ sustainability performance and goals. The majority of Datwyler’s customers operate in socially important market segments. Together with them, Datwyler can amplify its impact and create high-quality end-consumer products that save lives while also helping to save the planet.
Our focus
With more than 100 years of experience and a global production footprint, Datwyler’s material, engineering, and production expertise helps to make it a market leader for system-critical elastomer components. Efforts to constantly improve allow the company to continually expand its innovative portfolio of products and services.
This keeps customers at the forefront of technological advancement by consistently engaging with them to demonstrate its dedication to their needs. Datwyler has a zero-defect philosophy and applies Quality by Design principles in its design and manufacturing processes. Sustainability has become another integral part of Datwyler’s value proposition to customers and helps the company to differentiate itself in the marketplace.
Our long-term ambition
Perceived as a sustainability leader by customers.
Future key targets
High rankings in customer service rating for sustainability.
Our approach
Supplying system-critical elastomer components
The elastomer components Datwyler produces for specific customers are system-critical parts. They are a key contribution to ensuring systems function properly and safely for customers in the socially important global Healthcare, Mobility, Connectivity, General Industry and Food & Beverage market segments.
Datwyler’s core competencies
Datwyler’s core competencies of solution design, material expertise, and operational excellence form the basis for its value-driven engagement and co-engineering approach with customers across industries. They allow Datwyler to support customers as a development partner—from the original design study and prototype phase through to global production of billions of parts based on a zero-defect philosophy throughout the entire life cycle of the product.
The value of Datwyler’s core competencies is becoming increasingly apparent to its globally active customers as they run ever more powerful and complex systems.
Product social impact in cooperation with our customers
Among other things, Datwyler components in billions of syringes and in every second car around the world make an important contribution to patient and driver safety under demanding conditions. Our elastomer components make a decisive contribution to the functionality and quality of customer systems while at the same time contributing very little to the overall costs of these systems.
In particular, our Healthcare components for injectable drugs are of crucial importance for the health and the well-being of mankind. The quality of these products is key to preventing undesirable negative effects. At a strategic level, our focus is on securing the availability of important medicine components in partnership with our customers.
Integrating sustainability into customer engagements
Datwyler is increasingly marketing its ambitious sustainability strategy and how it can add value to customers. All global customer-facing teams are trained on Datwyler’s sustainability program and encouraged to always include sustainability in the value proposition presented to customers. It is Datwyler’s explicit goal to encourage sustainability-related collaborations with customers to maximize impact.
Customers are also increasingly keen to discuss and collaborate with Datwyler on sustainability topics, sending questionnaires on environmental and social issues, and having raised expectations, such as being informed about the carbon footprint of the products supplied to them.
Systematic complaints management
Datwyler maintains a systematic approach to complaints management with a global process and uniform database. The internationally recognized 8D reporting concept is used to process complaints and resolve the underlying problems. Datwyler also endeavors to define detailed product specifications with customers in advance to avoid the potential for future complaints. The quality management system focuses on building quality and avoidance of complaints. The aim is to continuously reduce justified complaints compared to the previous year.
Customer satisfaction
Datwyler regularly surveys customer satisfaction— most recently in the fourth quarter of 2023. The number of questions on sustainability in the customer satisfaction survey was increased in 2023 in order to better understand how customers perceive our sustainability performance. We are pleased to report that we received a meaningful number of responses from our customers. The survey asked customers to rate Datwyler's commitment to sustainability, performance on sustainability governance, meeting sustainability requirements, and sustainable innovations compared to competitors. In all sustainability-related questions, our customers rated the performance of Datwyler better than that of our peers. Customers consider sustainability as important, with only price competitiveness and sales competency being considered more relevant.
Datwyler representatives regularly attend trade fairs to engage in dialog with customers and other partners and learn more about their needs.
Continuous improvement process
Datwyler uses the results of customer surveys and complaints management to identify and implement measures for improvement. These are part of the systematic management process and thereby help ensure the service customers receive keeps on getting better. For example, Datwyler uses Tech Days on site with existing and potential customers from the Mobility business unit to strengthen relationships and raise awareness of its competencies and offerings. Doing business with Datwyler must be simple for existing and potential customers.
This is why the company wants to develop an even better understanding of the future requirements and needs of its markets and customers. This kind of proactive approach will help Datwyler benefit from changes within the international supplier industry, since customers in global market segments have been steadily reducing the number of suppliers they use and tending to work more closely with those they retain. Datwyler is thus increasingly becoming a development partner with the ultimate aim of saving costs and conserving resources.
Customer health and safety and chemical compliance
Datwyler meets a variety of chemical law requirements at its production locations as well as additional industry and customer-specific rules. Almost all Datwyler Group products are subject to statutory information obligations in the countries of use. Chemicals legislation and the EU REACH regulations regarding the physical composition of products are of particular relevance. REACH (EU Regulation 1907/2006), together with CLP (EU Regulation 1272/2008), are considered the most restrictive chemical regulations in the world, in terms of safety and handling of dangerous chemicals.
With its proactive chemical compliance management, Datwyler goes above and beyond legal requirements, with the aim of protecting the lives of its workers and customers by offering products that can withstand the numerous demands of a constantly changing global market. Again, in the 2023 reporting year, Datwyler recorded zero incidents of non-compliance with provisions of conduct relating to the impact of products on the health and safety of users.
Focus topic
Human rights and equal opportunities
Datwyler company values are key to our success and act as strong roots in our growth strategy, shaping the culture and leadership at each of our locations around the world. We recognize that business, wherever it operates, may potentially have an impact on human rights, either through its own operations or via business relationships along the value chain. As such, we treat the respect for human rights as a priority and require our business partners to do the same. This is reflected in the corporate value “We have respect for others” and in our Code of Conduct.
Our focus
Datwyler wants to increase all of its global operations and employees’ awareness to the human rights topic and to the potential impacts on human rights, not only in its own operations but also along its value chain. With this increased awareness and focus on the topic, we expect that we and our business partners will become increasingly more proactive and effective in identifying, addressing, and successfully preventing, ceasing, or mitigating potential human rights issues.
Our long-term ambition
Human rights considerations naturally taken into account in all business decisions.
Future key targets
Embed human rights due diligence and considerations in all applicable key processes, contracts, and relationships along the value chain.
Our approach
Human Rights
Datwyler is committed to aligning its Human Rights Due Diligence (HRDD) framework with internationally recognized frameworks, namely the United Nations Guiding Principles and the OECD Guidelines for Multinational Enterprises. This framework includes six steps, as per the HRDD Governance Model highlighted on the chart, which ensure that the business proactively and continuously takes measures to identify, assess, cease, prevent, or mitigate actual or potential human rights risks and impacts.
Our commitment
Datwyler is committed to high standards of business ethics and integrity, including the support and respect for human rights and labor standards. This commitment is reflected in our official company values and in our Code of Conduct, our overarching compliance document.
Datwyler company values are key to our success and act as strong roots in our growth strategy. Along with the Code of Conduct, these values shape the culture and leadership at each of the Datwyler locations around the world. ln particular, our value "We have respect for others" contains an uncompromising commitment that all our employees, regardless of position, function, or location, act with high integrity and embrace the Datwyler Code of Conduct.
Additionally, by joining the UN Global Compact in 2009, Datwyler has committed itself to the ten principles relating to human rights, labor standards, environmental protection, and anti-corruption initiatives, having communicated on its progress ever since.
We recognize that business, wherever it operates, may potentially have an impact on human rights either through its own operations or via business relationships along the value chain. As such, we treat the respect for human rights as a priority and require our business partners to do the same.
During 2023, to further formalize and specify our commitment to support and respect human rights by adopting responsible business practices aligned with internationally recognized human rights standards, we have developed and approved, by both our Board and Executive Management, a dedicated Human Rights Policy that is globally valid and underlies all business activities and relationships, and that sets out our human rights due diligence (“HRDD”) framework.
We are guided by international human rights frameworks, which include but are not limited to the United Nations Guiding Principles on Business and Human Rights (UNGPs), the Universal Declaration of Human Rights (UDHR), the International Covenant on Civil and Political Rights (ICCPR), the International Covenant on Economic, Social and Cultural Rights (ICESCR), the International Labour Organization (ILO) Core Labor Conventions, the UNICEF Children's Rights and Business Principles (CRBP), and the OECD Guidelines for Multinational Enterprises.
Human Rights Due Diligence
Datwyler’s goal is to conduct a human rights due diligence process throughout the business to proactively identify, assess, cease, prevent, or mitigate actual or potential human rights risks and impacts along the value chain. To this end, we are committed to align our HRDD framework with internationally recognized standards such as the UNGPs and the OECD Guidelines for Multinational Enterprises.
The whole process of identifying, assessing, and prioritizing potential human rights issues involved the consultation of over thirty internal and external stakeholders from different sectors, functions, and geographies. Based on this process, eleven human rights issues were identified as the most relevant which, after further analysis, based on the potential severity of each issue’s impact and the company’s leverage, resulted in our salient human rights issues.
These salient human rights issues will be periodically re-assessed via systematic human rights risk and impact assessments conducted in accordance with the UNGPs.
In order to further disseminate human rights-related prevention and mitigation measures, these will be, to the extent possible, progressively integrated into the company processes, training, and documents.
As initial priorities, we have focused and delivered on the following: publication of our Human Rights Policy on the company’s website, dissemination of the Human Rights Policy across all our global entities, initial training and communication, update of our Code of Conduct and Supplier Code of Conduct.
Datwyler commits to report, in its annual sustainability report, on the progress of its efforts to address the identified and prioritized human rights issues and mitigation measures.
To monitor and track the effectiveness of our defined mitigation measures we use a management system with specific key performance indicators that allows us to have a clear view of the progress being made.
Key performance indicators include the number of processes and documents in which human rights issues are included, the numbers of suppliers that are assessed for human rights risks, the number of sites that are assessed for human rights risks and the number of human rights due diligence training sessions.
Equal opportunities
Datwyler has zero tolerance for discrimination, humiliation, oppression, harassment, or insults relating to anyone’s gender, origins, nationality, culture, religion, or color. This is clearly laid down in the Code of Conduct, with punishments ranging from sanctions to dismissal.
Our vision is to create an inclusive culture, where all of us can flourish – and build a sustainable future, together. One of our metrics to take our company’s DEIB pulse is the number of female employees in management positions, where the quota increased from 19.4% to 19.9%.
Focus topic
Engagement for sustainability
At Datwyler, we're not just about business; we're about making a positive impact in the neighborhoods where we operate. We understand that we have a responsibility to help our local communities thrive.
One way we do this is by getting involved in local projects that make a real difference in people's lives. We believe that our success is closely linked to the well-being of the places we operate in. We're a part of your community, working together for a better future.
Our focus
Datwyler’s commitment to local communities goes beyond paying fair wages and taxes. We actively contribute by making donations, encouraging volunteer efforts, promoting education, and enhancing local infrastructure.
Our long-term ambition
Engage Datwyler people at all locations in relevant community work.
Future key targets
At least one external community activity per location, per year.
Our approach
Contributing to society
In July 2023, when an extratropical cyclone struck the region of Sao Leopoldo in Brazil, Datwyler swiftly extended its support to the employees at the Brazilian manufacturing site. Datwyler and its local teams demonstrated remarkable solidarity by offering financial assistance for immediate needs and donating to alleviate basic necessities, providing much-needed relief during a challenging time.
Fostering local communities
As a significant regional employer, Datwyler’s larger facilities play a pivotal role in generating both direct and indirect economic advantages for the local areas they serve. Municipalities benefit not only from the taxes paid by Datwyler and its employees, but also from the impactful community projects initiated at the sites. These projects align with Datwyler’s guiding principles, focusing on education, addressing critical human needs, and promoting the inclusion of minority groups.
Our objective is to ensure that every Datwyler location actively engages in at least one local community project per year. A 2023 analysis revealed, that already 70% of all sites engaged in at least one external community activity. By consistently sharing our community efforts, both internally and externally, we aim to create a ripple effect that inspires others to go above and beyond. We encourage our colleagues worldwide to contribute their innovative ideas, as they are the ones who best understand the local needs and priorities.
Video content
This website uses no cookies by default and hides content which requires cookies to be displayed. If you want to see content like this you have to allow third party cookies. Read more about cookies in our Privacy policy.
It's heartwarming to witness initiatives where global multi-disciplinary teams allocate time from their workshops to give back to the community. These endeavors not only have a positive impact on the community, but also foster unique bonds within the teams, creating a sense of purpose and unity through volunteerism.
In 2023, we supported the Ronald McDonald House via our location in Middletown, USA and the Susan G. Komen Breast Cancer Foundation via the team in Jasper, USA. Our Belgian site collected clothing and supplies for people in need who live in the neighborhood. In Italy, volunteering employees and their families accompanied a group of young adults with disabilities to enjoy a day out on the skiing slopes.
3.7 Regulations and standards
Reference table on the non-financial matters of the Swiss Code of Obligations
This annual and sustainability report covers the information on non-financial matters required by the Swiss Code of Obligations. The table attached shows the relationship between the material topics for Datwyler and the non-financial matters in accordance with Article 964b of the Swiss Code of Obligations.
Datwyler is reporting on climate-related risks and opportunities according to the TCFD guidelines (Task Force on Climate-related Financial Disclosures) for the first time. The report on governance, strategy, risk management, key metrics and targets indicates how Datwyler identifies and deals with physical and transitional risks and opportunities that are caused by climate change and may have a financial impact on the company.
Since 2009, Datwyler has been a member of the UN Global Compact. At the link below, you will find the Communication on Progress, which summarizes significant aspects of the ten principles of the UN Global Compact.