3.1 Highlights

Governance


Social


CEO statement
Datwyler is aware of its social and environmental responsibility and pursues a sustainability strategy with twelve focus topics. These are structured according to the globally recognized ESG concept (Environmental, Social and Governance). Each topic bundles activities related to current and future projects and contains clear responsibilities with measurable targets and quantifiable key figures for effective management.
As early as 2009, we joined the UN Global Compact and committed ourselves to complying with its ten principles on human rights, labor practices, environmental protection and anti-corruption.
And for the fifteenth time, we are publishing a sustainability report in accordance with the globally recognized guidelines of the Global Reporting Initiative.
Sustainability and operational excellence now an Executive Management function
As of 1 November 2022, we have combined the existing activities to increase sustainability and operational excellence in a new function in Executive Management and appointed Sabrina Gérard as Chief Sustainability Officer and as a new member of the Executive Management.
This demonstrates that we see sustainability as an integral part of our business, even in a challenging environment, and are driving it forward for the benefit of our customers and all other stakeholders.
Further reduction in relative CO2 emissions
In the year under review, we worked on implementing our climate strategy and eco-design, among other things. A good example is our research into replacing petrochemical materials with those made from renewable raw materials. For this, we have patented a promising process for obtaining fillers from organic cellulose. As part of our climate strategy, we have commissioned our own photovoltaic systems at five additional sites. As a result of this and other measures, the amount of electricity from renewable sources increased by 16.4% to 87’729 MWh.
This corresponds to some 36.6% of total electricity consumption. We integrated the newly acquired companies QSR and Xinhui, with plants in the USA, Mexico and China, into our sustainability activities from the beginning. Due to the strong acquisition-related and organic sales growth of 21.4%, absolute resource consumption has increased. In relative terms, however, we have made further progress. For example, thanks to the measures implemented, we have succeeded in reducing CO2 emissions per unit of sales by a further 4.7%.
Sustainability measures for calculating the variable incentive
In order to embed the topic of sustainability even more firmly in the company, we have included three sustainability metrics with a total weighting of 20% in the calculation of the variable incentive for all eligible employees for the first time in fiscal year 2022. True to our mission «We materialize ideas for a safer, smarter and more sustainable world», Datwyler supports its customers in implementing innovative systems and, among other things, makes an important contribution to the safety of patients and drivers around the world.
In addition, new Datwyler components and materials for electric vehicles support the transformation to e-mobility and the achievement of climate targets. The electrical connector seals from the newly acquired QSR are also making a particular contribution to this.

3.2 Commitment
and meaning
About Sustainability
at Datwyler
Sustainability is about balancing economic, social, and environmental responsibility. Within the Datwyler Group, sustainability is one of four strategic priorities embedded in everything Datwyler does, from product development and production to customer support and human resource management.
Given the considerable importance of sustainability to the company, employees, and communities where it does business, Datwyler integrated the sustainability report into the annual report and applied –as in many years before– the Global Reporting Initiative (GRI) standard as an external reporting framework.
News and stories
Datwyler is continuously working on the implementation of its sustainability objectives and reports on this in current news and stories on its website.
Decision maker in charge
for sustainability
Ambitious sustainability goals can only be achieved if they are carried across all units and levels of a company. At Datwyler, the entire management team is committed to sustainability and drives developments in their individual areas of responsibility.
Datwyler ready to respond
to external ESG trends
In recent years, corporate sustainability has gained significantly in importance, especially for listed companies. The primary driver has been the increasing global risk of climate change, which has been playing a major role in politics and society.
Being aware of its responsibility toward its stakeholders, society, and the environment, Datwyler is ready to: respond to climate change; improve ESG compliance, transparency, and performance; make a long-term transition toward a circular economy with products and services based on life-cycle thinking; navigate demographic and social changes that affect future consumer and employee expectations; and respond to industry-specific sustainability trends such as individual, digitalized healthcare approaches and electric mobility.

Responding to climate change
Reducing carbon emissions substantially toward long-term climate neutrality
Committing to Science Based Targets to contribute a fair share to Paris agreement on climate protection
Climate positivity replacing net-zero

ESG compliance, transparency, and performance
Integrating ESG in business processes
Linking executive compensation to ESG performance
Integrating sustainability risks in business risk management
Meeting investor and regulatory ESG requirements

Applying technology to sustainability
Businesses will accelerate efforts to add carbon footprint labels to products
Reduce, Reuse, Recycle
Building sustainable and resilient supply chains
Life-cycle thinking across company (no silos)

Sustainability becomes the new "normal"
Digitalisation in all aspects of life
Diversity in management and workforce
Valuing human capital: Connect work more closely with purpose to retain and engage employees

Industry-specific sustainability trends
Aging population in Europe with specific health requirements
Digital and individual approaches to healthcare
World-wide pandemic
Electric mobility and lightweight vehicles
«Advance Sustainability» as proactive strategic priority
For Datwyler, sustainability means operating successfully in the present, while also being oriented toward the long term. Thus, the company wants to not only be responsive to current global and market trends, but to proactively contribute to shaping a sustainable future. A long-term orientation means striking a balance between economic, environmental, and social aspects in all decision-making processes.
Datwyler’s vision is to become a truly sustainable company focused on people, planet, and profit. This vision is inspired by the company’s intrinsic motivation to safeguard what is most essential for the business and its shareholders, customers, workforce, and their families. Building on more than 100 years of corporate history and over a decade of sustainability achievements, when Datwyler made sustainability a strategic priority in 2020, it reinforced the importance of integrating sustainability across the company’s activities.


As part of the four strategic priorities, sustainability is an important driver for the Datwyler Group. To further strengthen the focus on sustainability and operational excellence, Datwyler expanded its Executive Management team by appointing Sabrina Gérard as new Chief Sustainability Officer (CSO).
In addition to the sustainability function, the new Executive Management function is also responsible for heading the uniform global production system and the global quality systems and processes. This enables Datwyler to improve performance and efficiency in all dimensions of sustainability.
Sustainability business integration and value creation for stakeholders
By adding sustainability as a fourth strategic priority, it is now considered an integral part of Datwyler’s overall strategy to improve opportunities and reduce risks.
In addition to helping the company sustain high profitability, sustainability initiatives have simultaneously created value for many stakeholders by:
Creating innovative and sustainable products for customers.
Decreasing its environmental footprint along the entire value chain.
Enhancing prospects for employees in numerous regions.
Offering attractive and equal opportunities for all employees.
Cooperating with suppliers and business partners based on fairness.
Modeling leadership for sustainable development in the industry.
Sharing success with communities close to production sites.
3.3 Material and focus topics
Datwyler conducted a comprehensive materiality analysis in 2016, assessing topics in terms of both business relevance and their impact on the economy, society, and the environment. In developing the new sustainability strategy, the selection of material economic, social, and environmental topics was revised and topics were further focused and clarified.
The accompanying analysis was performed by the Sustainability Team and reviewed and confirmed by the Executive Management. No external stakeholders were consulted during the update of the materiality analysis. The results of the materiality analysis and the twelve ESG focus topics show a high level of alignment, which was an objective of the strategy process.

Twelve ESG focus topics
for further development
In 2021, Datwyler established an ESG landscape with twelve focus topics that embody the company’s commitment to reducing its environmental footprint and delivering more value for all stakeholders. The focus topics are structured according to Environmental, Social, and Governance (ESG) priorities and are intended to close gaps and build on existing strengths.
Each topic bundles activities relating to current and future projects, and contain clear responsibilities with measurable objectives, derived measures, and quantifiable key figures for effective monitoring.


Environmental
Reduce footprintReducing its ecological footprint is an important aspect of sustainability, supported by many of Datwyler’s stakeholders. To achieve this, one of the company’s environmental initiatives is to attain climate neutrality (scope 1 + 2) by 2030 following the Science Based Targets approach. Other environmental initiatives focus on: embedding eco-design principles into its product and manufacturing development processes; increasing sustainability awareness and life-cycle thinking in the company; reinforcing initiatives to reduce water, heating, and electricity consumption; reducing waste generation; and finding sustainable procurement solutions through the supplier base that align with internal and external benchmarks.
Social
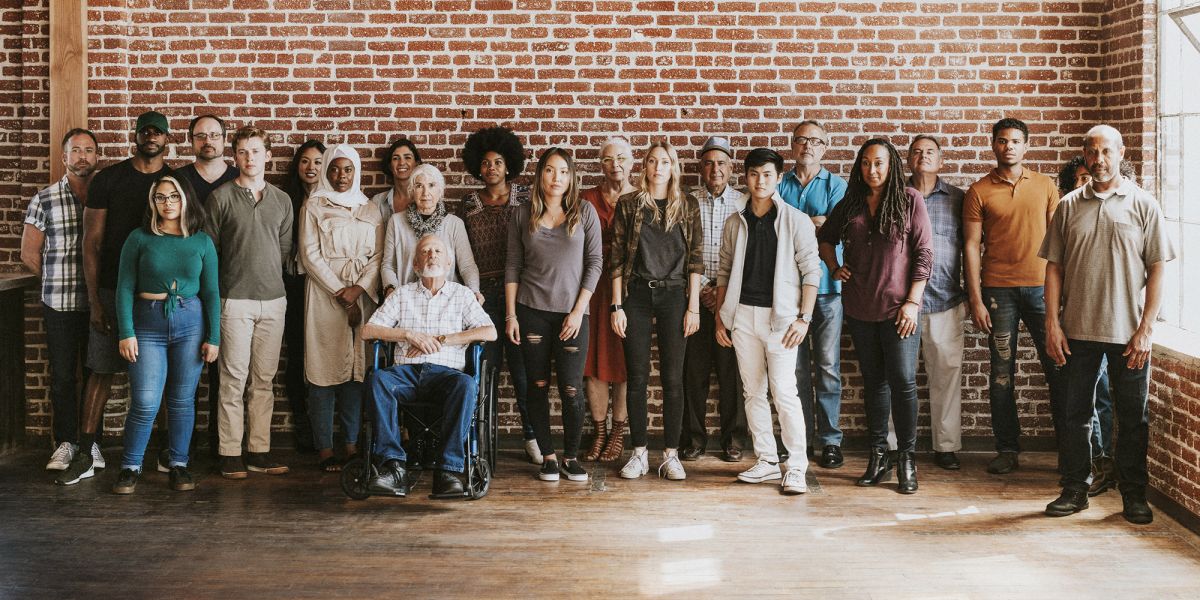
Deliver more valueBy focusing on social activities Datwyler aims to deliver more value and meaningful purpose to its customers, employees and communities. Employee satisfaction and commitment are crucial for continued success and employer branding. Having a dynamic, diverse, and multicultural workforce brings several advantages such as increased productivity and creativity, improved cultural awareness, a positive reputation, employee empowerment and engagement, and expanded marketing opportunities. As one of the largest employers in the regions, Datwyler has a responsibility to elevate local communities. By supporting charitable projects and enabling employees to engage with their community, Datwyler creates a sense of pride and belonging, while simultaneously increasing its reputation both as an employer and community member. Other social initiatives include: engaging with customers to co-create sustainable products and safeguarding the safety and health of the workforce.
Governance
Be responsibleIn the area of governance, Datwyler focuses on continuous development of transparency, compliance and ethics, diversity of the Board of Directors and Executive Management, and commitments such as integrating a sustainability component into variable pay for all bonus-eligible employees.
Top 10 goals
To make the ESG focus topics more tangible, Datwyler developed its top 10 sustainability goals for 2030.
Environmental
Climate-neutral operations (scope 1+2) by 2030 applying the Science Based Targets (SBT) approach.
All new product developments include eco-design check by 2023.
Waste-free production and 3% annual reduction in water consumption relative to revenue.
Social
Employee commitment rates above industry benchmark for all sites.
Perceived as sustainability leader by customers.
Zero accidents and zero injuries and healthy working environment.
At least one annual external community activity per location.
Governance
Be among top 25% in all relevant sustainability ratings.
Have ≥20% of women in executive management.
Code of Conduct signed by all suppliers.
Contribution to the SDGs

Ensure healthy lives and promote well-being for all at all ages.
![]() Safe and healthy workforce
Safe and healthy workforce ![]() Customer Health and Safety and Chemical Compliance
Customer Health and Safety and Chemical Compliance

Ensure inclusive and equitable quality education and promote lifelong learning opportunities for all.

Achieve gender equality and empower all women and girls.
![]() Employer of choice
Employer of choice![]() Diversity of the Board of Directors and Executive Management
Diversity of the Board of Directors and Executive Management

Promote sustained, inclusive and sustainable economic growth, full and productive employment and decent work for all.

Build resilient infrastructure, promote inclusive and sustainable industrialization and foster innovation.


3.4 Governance
Datwyler focuses on continuous development of transparency, diversity of the Board of Directors and Executive Management, commitment, and compliance and ethics, such as a proactive chemical compliance management.
Sustainability (ESG) Governance
Oversight and execution of the sustainability (ESG) strategy at Datwyler
A strong governance framework is key to ensuring that the sustainability (ESG) strategy Datwyler has committed to is incorporated into the corporate agenda.
The governance of sustainability (ESG) is integrated into the corporate governance structure throughout the Group – from Board level to management level, Group functions, Business Units and all associates.

Datwyler Board of Directors
The highest governance body at Datwyler is represented by the Datwyler Board of Directors (BoD) and has overall responsibility for Datwyler’s ESG strategy and reporting.
In line with the Board of Directors’ responsibility to determine the principles of corporate strategy (see the Corporate Governance section), the Board oversees the executive management on matters required to enable:
the Datwyler Group to operate on a sustainable basis for the benefit of current and future generations;
the development and adoption of the Datwyler Sustainability (ESG) Strategy and related policies, including the Sustainability (ESG) landscape and the Top 10 Goals;
the effective management of ESG related risks;
the communication of critical concerns to the highest governance body;
the development of ESG knowledge at BoD and group level.
While the Board is responsible for oversight, the Datwyler Executive Team ensures the implementation of the Sustainability (ESG) Strategy.
The Executive Management Team
C-levelImplementation responsibility for sustainability (ESG) lies with the Executive Management Team consisting of the C-level.
The Executive Management Team has defined ‘advancing sustainability’ as one of the four strategic priorities and has established sustainability (ESG) related objectives for the organization. For each objective measurable Key Results are defined and led by a Key Result (KR) owner.
The CSO (Chief Sustainability Officer) coordinates the sustainability activities within the organization and has regular exchange meetings with the KR owners.
Business integration
The KR owners initiate and track key activities related to their Key Result and report progress on a quarterly basis to the Executive Team members. The Objectives and Key Result (OKR) system uses an iterative approach which facilitates to handle complex topics in an agile way.
Everyday sustainability topics are managed, as appropriate, by the sustainability functions, business units, sites and other corporate functions such as human resources, procurement, technology and innovation, communications, development, engineering, and compliance.
All Datwyler associates contribute to the Datwyler sustainability journey.
Collective knowledge of the highest governance body
Annual knowledge exchange sessions are organized for the BoD members with the goal of advancing the collective knowledge, skills and experience in sustainable development.
In 2022 the following topics were presented to the BoD:
Understanding the ongoing sustainability trends from a market, customer and compliance point of view (BoD meeting May 2022)
Datwyler’s ongoing and planned sustainability activities to respond to these trends (BoD meeting May 2022)
Why is sustainability important to Datwyler (key figures, internal stories, voice of the customer and next generation) (Group seminar June 2022)
Sustainability booth (Group seminar June 2022):
Diversity, Equity and Inclusion
Eco-design
Environmental sustainability
Next generation
Engagement for sustainability
The new knowledge exchange overview for 2023 will be presented to the BoD during the May BoD meeting.
Evaluation of the performance of the highest governance body
Each year the BoD Chair takes the initiative to evaluate the skill set of the BoD members by using an independent evaluation questionnaire assessing e.g. leadership, culture, role clarity, teamwork, accountability, decision making, communications, board operations. This questionnaire includes economic, environment, social and governance related questions.
The questionnaires are completed individually and reviewed by the Chair. Actions to close gaps related to the boards operation and skill set are taken if needed.
Risk management
As a globally active company, Datwyler has an institutionalized and systematic risk management system. Risks are divided into four categories: strategic, operational, financial, and compliance. Sustainability risks are translated into one or several of these business risk categories according to their impact at Group level as well as at business units and production site levels.
Communication
of critical concerns
Critical concerns include concerns about the organization’s potential and actual negative impacts on stakeholders raised through grievance mechanisms and other processes. They also include concerns identified through other mechanisms about the organization’s business conduct in its operations and its business relationships.1
At Datwyler, critical concerns are immediately reported by the CEO or CFO to the Board of Directors (BoD). An overview of critical concerns is included in the compliance report and reported to the BoD twice a year by the CFO. Potential critical concerns are reported by the CFO in the annual risk management report.
_____
Definition taken from GRI standards, GRI 2: General Disclosures 2021

Transparency
Datwyler believes transparency is fundamental for stakeholders to recognize the company as a reliable partner. The company has consistently disclosed its ESG performance against leading and internationally recognized frameworks and published a sustainability report in accordance with GRI and the ten principles of the UN Global Compact since 2009.
The company has also disclosed its energy consumption and resulting CO2 emissios to CDP (Carbon Disclosure Project) since 2013, and in 2022 for the first time also its water consumption. Datwyler has received the silver rating for sustainability performance from the globally recognized rating agency EcoVadis for the fourth time in a row in 2022. This places the company in the top 15% of more than 90'000 companies from 160 countries analyzed by EcoVadis. Within the elastomer industry, Datwyler counts among the top 8% of companies examined, according to EcoVadis.

UN Global Compact
With more than 11,000 members, the United Nations Global Compact promotes awareness of the social and ecological responsibility of business.

Carbon Disclosure Project
CDP operates a leading global system for reporting on energy and resource consumption on behalf of institutional investors.

EcoVadis
EcoVadis is one of the world’s leading providers for corporate social responsibility (CSR) audits. 90’000 companies from 160 countries have been assessed already.

Global Reporting Initiative
The GRI Standards are the most widely used standards for sustainability reporting worldwide.

Compliance and Ethics
A fair and responsible partner
Datwler aspires to have an industry-leading ESG/sustainability policy framework that is continuously evaluated and improved. Datwyler’s first Code of Conduct—which is binding for all employees at all sites across the Group—was published in 2008. This code mandates that the companies and employees within the Group must respect the national laws, human rights, personal dignity, and privacy of each individual person.
In its Code of Conduct and with its participation in the UN Global Compact, the Datwyler Group has firmly committed itself to protecting human rights. Additionally, since 2020, sustainability has become one of the Group’s key strategic priorities, reinforcing its commitment with people and planet. To put this into practice, topics related to human rights and sustainability have been embedded in various policies and processes within Datwyler Group, such its Supplier Code of Conduct, audits, or its DEI, Whistleblowing, Anti-Fraud, Anti-Money Laundering policies, just to name a few.
In 2022 the internal Global Business Continuity Planning (BCP) process includes enhanced focus on risks related to the environment (cf TCFD), human rights (e.g. child labour) and conflict minerals. First BCP assessments including the increased risk related focus items have been conducted in January 2023.
Datwyler has zero tolerance for discrimination, humiliation, oppression, harassment, or insults. The Code of Conduct also articulates how to deal with business partners and competitors, strictly prohibiting any special treatment, bribery, or corruption. For example, clear rules are defined in the code for placing orders, awarding sponsorship money, and dealing with conflicts of interest. Datwyler has defined expectations of suppliers in a separate Supplier Code of Conduct. With a publicly available tax strategy, Datwyler assumes its social responsibility and commits not to engage in aggressive tax planning.

Diversity of the
Board of Directors and Executive Management
A Diversity, Equity, and Inclusion (DEI) policy has been in effect since June 2021. In addition, a Diversity Council was established and charged with defining targets for DEI key performance indicators and overseeing the implementation of DEI measures.
Rising diversity in Datwyler’s Board of Directors and Executive Management
Regarding female representation in leadership positions, Datwyler has set concrete goals in line with regulatory requirements of the Swiss government: By 2025 the Board of Directors should reach 30% female representation while female representation in Executive Management should reach 20% by 2030. To achieve this goal, Datwyler makes no compromises on the required competencies. However, if different candidates have comparable qualifications, the one who can contribute positively to the diversity of the board or of executive management is preferred.
At the end of 2022, female representation of the Board of Directors was at 25% (previous year: 12.5%) with the election of Judith van Walsum as a member of the Board of Directors as of March 16, 2022.
The appointment of Sabrina Gérard as Chief Sustainability Officer and member of the executive team increased the female representation of the executive management to 20% as of 1st of November 2022. In 2021, the executive management consisted entirely of men. Therefore, the Datwyler Group has already reached its 2030 goal at least 20% female representation in Executive Management.

Commitment
On the basis of the sustainability strategy, which was enhanced in 2021, the Board of Directors has decided to add a sustainability indicator to the variable incentive model. The new sustainability performance indicator determines 20% of the variable incentive and has been applied for members of the Executive Management and for all eligible employees from 2022 onward. The two previous performance indicators—net revenue growth and EBIT—will be taken into account at a rate of 40% each. The model for calculating the variable incentive is described under «variable incentive.»
The measurement parameters for the sustainability performance indicator are derived from the twelve focus topics of the enhanced sustainability strategy. They can be redefined by the Board of Directors annually.
The Board of Directors has defined the following three measurement parameters for 2022:
reduction of CO2 emissions (scope 1 and 2) in relation to revenue (weighted at 50%)
reduction in accident severity (25%)
employee commitment (25%)
For all three parameters, there is a minimum threshold that has to be achieved in order to be taken into consideration and a maximum limit above which the contribution to target achievement no longer increases.
By taking sustainability measurement parameters into account in the variable incentive for all eligible employees, Datwyler is promoting awareness of the sustainability focus areas.
3.5 Environmental
In the area of environment, Datwyler focuses on climate-neutral operations 2030, eco-design, resource-friendly production and sustainable procurement.
In parallel with the continuous reduction in relative resource and material consumption, Datwyler is striving for climate neutrality (scope 1 + 2) at its own sites by 2030 through applying the Science Based Targets approach.

Climate-neutral
operations 2030
Climate change poses a critical risk to society and the global economy. The leading scientific organization IPCC sees evidence that climate change is «widespread, rapid, and intensifying». The Paris Agreement, which was concluded in December 2015 at the Paris Climate Conference, is the leading global climate protection agreement. The Science Based Targets Initiative (SBTi) guides companies to contribute to the agreement and to develop reduction plans for greenhouse gas emissions that limit global warming to 1.5°C. Through applying SBTi guidelines, Datwyler is seeking to contribute its fair share in reducing the risk of climate change.
Our focus
Datwyler has set a goal to achieve climate neutrality for its own operations (scope 1 and 2) by 2030. Beginning with emissions of approximately 80'000 tons of CO2eq in 2020, Datwyler is following the 1.5°C reduction path defined by the SBTi, which includes implementing measures to purchase renewable energy, increase energy efficiency, and invest in its own production of renewable energy. The base year will be revised as soon as the full-year data of the newly acquired sites are available.
These actions are intended to drastically reduce greenhouse gas emissions despite forecasted business growth. In addition, greenhouse gas emissions that can’t be avoided will be offset from 2030 onward in order to achieve climate neutrality. Datwyler is also focused on quantifying the Scope 3 emissions, mainly related to buying materials from suppliers for production and to transportation by third parties.
Our long-term ambition
Climate-neutral operations (scope 1+2) by 2030 through applying the Science Based Targets (SBT) approach.
Our future key targets
Reduce electricity consumption by 3% and heating consumption by 6% relative to revenue.
Our approach
Ambitious commitment to climate target
Energy management at the production sites is part of the integrated Environmental Management System (EMS) and is part of the Datwyler Production System. A global Sustainability Manager coordinates the energy management across all plants and is supported by a dedicated EHS officer at each individual plant.
Datwyler commits to a far-reaching climate target for its operations: climate-neutral operations by 2030. The SBTi offers a 1.5°C reduction pathway to calculate Datwyler’s «fair share» in reducing carbon emissions in order to help achieve the 1.5°C level. The overall reduction pathway offers guidance for Datwyler on the reductions needed to reach this goal by 2030 and beyond.
Determining the specific investments needed to achieve greater energy efficiency is one focus of the implementation program. A detailed plan for implementation at the production sites is currently under development. Purchasing renewable energy and the self-generation of electricity will be a main contribution to achieving our goals. Datwyler’s electricity consumption was approximately 75% in 2022 of its overall energy consumption. In 2022, five sites installed photovoltaic systems: Montegaldella, Pregnana and Viadanica, all in Italy, Schattdorf in Switzerland and Karslbad in Germany.


_____
Due to the acquisitions of QSR and Xinhui, the share of electricity from renewable sources for 2022 is 36.6% (1: without the acquisitions, the share of renewable electricity would be 44.6%). The newly acquired sites are currently being integrated into Datwyler's sustainability strategy and targets with the intention of also increasing their share of electricity from renewable sources over the next few years.

The main goal is to reduce greenhouse gas emissions as much as possible by 2030. The so-called non-avoidable emissions will be offset after 2030 in order to achieve climate neutrality for the company’s operations. Datwyler is aware that the greenhouse gas emissions outside its operations—so-called Scope 3 emissions—exceed the greenhouse gas emissions of its own operations.
In 2021, a project was launched to identify and quantify Scope 3 emissions, such as in the procurement of materials for production. The project is still ongoing in 2022. Initiatives like applying eco-design in product development help to identify measures to reduce Scope 3 emissions in the future, such as by choosing low-carbon materials and reducing material consumption. Specific targets on Scope 3 emission reduction are not currently set but will be developed step by step.
2022 with 4.7% relative
carbon emission reduction.
Datwyler has been recording the energy consumption and greenhouse gas emissions caused by its own operations for many years. The results of the last five years are shown in the accompanying table.
The five-year track record reveals an increase in energy consumption mainly resulting from business growth, new plants and acquisitions.
In 2022, Datwyler’s operations were responsible for emissions of about 90'478 tons CO2eq (scope 1 and 2)— the increase of 15.8 % compared to 2021 is due to the acquisitions of QSR and Xinhui. Thanks to the measures implemented to improve energy efficiency and the switch to renewable electricity, relative CO2 emissions have decreased by 4.7% compared to 2021.
The plants in Schattdorf and Sao Leopoldo have been using renewable electricity since 2012 and 2016, respectively. In 2020, two plants, Alken and Vandalia, transitioned to renewable electricity. In 2021, four more—Pregnana, Montegaldella, Viadanica, and Karlsbad-Itterbach—switched to renewable electricity. The plant in Novy Bydzov has been purchasing renewable electricity since 2022, resulting in a reduction of CO2 emissions by almost 7,000 tons per year. At the end of 2022, 36.6% of Datwyler’s total electricity consumption at all plants came from renewable energy sources.


Energy consumption
2018 |
2019 |
2020 |
2021 |
2022 |
|
|---|---|---|---|---|---|
Total energy (MWh) |
233'053 |
243'343 |
247'079 |
267'876 |
308'934 |
of which renewable sources (MWh) |
21'513 |
25'731 |
39'610 |
79'117 |
90'856 |
Proportion of renewable sources |
9.2 % |
10.6 % |
16.0 % |
29.5 % |
29.4% |
Total energy per revenue (MWh/CHF millions) |
261.5 |
265.8 |
296.2 |
282.7 |
268.5 |
Heating fuels (MWh) |
39'650 |
42'272 |
60'387 |
64'001 |
66'220 |
Heating fuels per revenue (MWh/CHF millions) |
44.5 |
46.2 |
72.4 |
67.5 |
57.6 |
Overview electricity + district heating (MWh) |
193'403 |
201'057 |
186'692 |
203'848 |
242'714 |
Of which electricity (MWh) |
189'878 |
197'036 |
183'109 |
199'959 |
239'507 |
of which renewable sources (MWh) |
18'474 |
22'182 |
36'162 |
75'375 |
87'729 |
Proportion of renewable sources |
9.7 % |
11.3 % |
19.7 % |
37.7 % |
36.6% |
Electricity per revenue (MWh/CHF millions) |
213.1 |
215.2 |
219.5 |
211.0 |
208.2 |
Of which district heating (MWh) |
3'525 |
4'021 |
3'583 |
3'889 |
3'207 |
of which renewable sources (MWh) |
3'039 |
3'535 |
3'448 |
3'715 |
3'127 |
Proportion of renewable sources |
86.2 % |
87.9 % |
96.2 % |
95.5 % |
97.5 % |
Revenue (CHF millions) |
891.1 |
915.6 |
834.1 |
947.6 |
1'150.6 |
For the reporting of energy consumption, all 27 production plants are included in 2022. For newly acquired companies, energy consumption was included in the first full calendar year until 2021. Accordingly, the energy consumption of the acquired companies Parco (USA) and Bins (Brazil) was included for the first time in 2019, as well as Middletown (USA) in 2020. Since 2022, the newly acquired companies are included right after the successful acquisition. The energy consumption of the acquired company Xinhui (China) was included for the first time in March 2022 and QSR (USA, Mexico and China) in May 2022. In addition to organic growth at existing plants, the inclusion of acquired companies explains the increase in absolute energy consumption.
Greenhouse gas (CO2) emissions
| 2018 | 2019 | 2020 | 2021 | 2022 |
|
|---|---|---|---|---|---|
Total emissions (tons) |
88'310 | 88'704 | 80'159 |
78'155 |
90'478 |
of which Scope 1 (tons) |
8'285 | 8'798 | 12'509 | 13'285 |
13'798 |
of which Scope 21 (tons) |
80'024 | 79'906 | 67'650 | 64'870 |
76'680 |
Total emissions per revenue (tons/CHF millions) |
99.1 | 96.9 | 96.1 | 82.5 |
78.6 |
Revenue (CHF millions) |
891.1 | 915.6 | 834.1 | 947.6 |
1'150.6 |
For the reporting of CO2 emissions, all 27 production plants are included in 2022. For newly acquired companies, CO2 emissions were included in the first full calendar year until 2021. Accordingly, the CO2 emissions of the acquired companies Parco (USA) and Bins (Brazil) were included for the first time in 2019, as well as Middletown (USA) in 2020. Since 2022, the newly acquired companies are included right after the successful acquisition. The CO2 emissions of the acquired company Xinhui (China) was included for the first time in March 2022 and QSR (USA, Mexico and China) in May 2022. In addition to organic growth at existing plants, the inclusion of acquired companies explains the increase in absolute CO2 emissions. The greenhouse gas inventory was calculated in line with WRI/WBCSD Greenhouse Gas Protocol guidelines. Scope 1: GHG emissions from combustibles. Scope 2: GHG emissions arising from the production of electricity and district heating purchased by the companies. Emissions factors used: IEA and DEFRA.
Results in the table stem from a ‘market-based approach’ where for 9 sites with 100% renewable energy actual emission factors were considered and for the rest of the sites the national grid emission factors were used. Under sole consideration of the ‘location-based approach’ (using national grid emission factors for all sites), greenhouse gas emissions associated with the production of electricity would account for 95’013 t CO2e in 2022 and 80’419 t CO2e in 2021. This shows that by purchasing electricity from renewable sources, Datwyler was able to reduce emissions by 18’333 t CO2e in 2022 (Difference between location-based and market-based approach).

Eco-design
Applying the highest quality standards during product development while striving for the utmost reliability and security are paramount to Datwyler’s success. This is reflected in the corporate value of «We excel in what we do». At the same time, the company must stay on top of future-oriented technologies, particularly regarding environmentally-friendly alternatives to the status quo. The concept of eco-design is hence moving to the forefront of Datwyler’s product development strategy.
Our focus
Datwyler’s quality management is based on internationally recognized quality and safety assurance systems, proactive chemical compliance, and innovative collaborations with higher education institutions, international standardization committees, and independent testing bodies.
The company believes that the concept of eco-design must be part of a holistic approach to quality product development that considers environmental, social, and economic benefits throughout the life cycle of products.
Our long-term ambition
Eco-design is integrated in all new product developments.
Future key targets
All new product developments include eco-design checks by 2023.
Our approach
Datwyler continuously invests in even better materials, process technologies, production equipment, and testing methods.
Quality assurance through standardized processes
Datwyler’s corporate processes are based on its production system and internationally recognized quality management standards. For example, plants making products for the automotive industry are certified in accordance with IATF 16949:2016, while healthcare plants (with the exception of the US plant in Pennsauken) have ISO 15378:2017 certification.
State-of-the-art clean room technologies paired with automatic camera inspections, among other systems, ensure impeccable quality for Datwyler’s over 300 billion manufactured components. In addition, the impacts of its products on user health and safety are closely examined. Line functions involved in procurement and production are supported by a global quality assurance function and by a local team for each plant.
Statutory information obligations as minimum standards
Almost all Datwyler Group products are subject to statutory information obligations in the countries of use, in addition to a variety of chemical law requirements and additional industry and customer-specific rules at its production locations. Chemical legislation and EU REACH regulations regarding the physical composition of products are particularly relevant. REACH (EU Regulation 1907/2006) governs the registration, assessment, and approval of chemical substances within the European Union.
In 2022 Datwyler succeeded in the substitution of a raw material with a Bisphenol-A alternative in a compound for General Industry products and a full substitution of carcinogenic mineral oil softeners. In its effort to proactively address SoCs (Substances of Concern), Datwyler is further engaging in analytical testing of finished products to determine if a full replacement is needed. This is also a commitment to its customers, to be able to produce clearer and more accurate statements that can help the entire supply chain.
Integration of eco-design in development and production
Eco-design principles offer a critical perspective when developing products that reduce the environmental impact across all its life cycle stages. Datwyler’s successful approach to eco-design optimizes the environmental performance of its products while also maintaining their functional qualities. This includes developing environmentally friendly elastomer compounds, optimizing design to save on materials, reducing process-related waste, and using reusable or recyclable packaging and boxes. But eco-design is more than simply reducing the environmental footprint of a product: this holistic approach helps developers think through social benefits and reconsider economic factors at the same time.
Recently, Datwyler launched an action plan that will guide the company through the next few years of integrating eco-design systematically across product development and across all life cycle stages of a product. Datwyler successfully implemented the «Idea Box» tool where ideas and initiatives from employees have been selected from a development team to initiate concrete projects aimed at minimizing the ecological impact in different areas.
The eco-design initiative is supported by external specialists and includes comprehensive eco-design trainings for different product development teams. A «train the trainer» approach aims at multiplication of the gained know-how across the organisation.
Another new core element are «eco-design checkboxes» for product developments. The check-boxes are specifically designed to cover "build-to-print" and "co-engineering" product categories and their implementation is envisioned for both Mobility and Healthcare business unit. This will ensure more flexibility in applying the eco-design approach in different areas. The "eco-design checkboxes" will be systematically integrated in new products development by 2023.
Pilot projects on Product Carbon Footprint (PCF) calculations and Life Cycle Assessments (LCA) for typical products in both Mobility and Healthcare are also part of this initiative.

Sustainability also considered as criteria in new material developments
Material deveopment is an area in which Datwyler has the most control over new materials. Researching new materials not only involves assessing the cost, manufacture, and performance of the final product, but also its environmental impact, from the sustainability of the raw materials to the compostability and overall recyclability of the component.
Datwyler is currently working on a number of projects that could reduce the requirement for fossil fuels in the elastomer manufacturing process. These projects include replacing an oil-based polymer with a polymer made from sugar cane, using a plasticizer based on vegetables rather than petroleum oil, replacing plastic-based fibers with modified cellulose, and many more.
The use of recycled materials is another important area for sustainability, and we have been investigating how scrap material produced during manufacture can be used in brand new components. The process involves grinding leftover material down to a fine powder, which is then added to the raw materials for new components. Not only does this reduce the volume of discarded material in the original process, but it also increases the amount of reclaimed materials in new products.
Resource-friendly production
Datwyler’s corporate values and the Datwyler Code of Conduct highlight the company’s commitment to the responsible handling of natural resources. In fulfilling its promise to be a responsible and sustainable company, Datwyler not only improves sustainability awareness but also gains a competitive advantage by attracting new customers. To uphold these goals, Datwyler has a vested interest in developing more resource-friendly production methods, such as reducing process-related elastomer waste through improvements in production processes and component engineering.
Our focus
Resource consumption in production is one of Datwyler’s focus topics, as it is a primary lever for reducing its environmental impact.
To achieve this, Datwyler’s priority is the gradual reduction of waste and water consumption, in addition to improved energy efficiency and increased use of renewable energies. Energy- and emission-related activities are reported here.
Our long-term ambition
Waste-free and highly water- and energy-efficient production.
Future key targets
Reduce waste volume relative to revenue by 3% per year
Reduce water consumption relative to revenue by 3% per year
Reduce electricity consumption relative to revenue by 3% per year
Reduce fuel consumption relative to revenue by 6% per year
Our approach
Datwyler Production System (DPS)
The Datwyler Production System, which is based on the company values and lean principles that guide Datwyler employees, is a long-term improvement program to foster a lean and agile culture and achieve operational excellence. As a shared program for continuous improvement, this system supports uniform production processes across all plants on all continents. For Datwyler, the quest for operational excellence means not only a safe workplace, high-quality products, on-time deliveries, and satisfied and empowered employees, but waste-free processes and environmental protection as well. This makes reducing the consumption of resources and protecting the environment an integral dimension in the pursuit of operational excellence.

Environmental Management System (EMS)
Within the Datwyler Production System, a certified and integrated Environmental Management System (EMS) provides the basis for optimizing resource use. This EMS aims to minimize the impact of the company’s operations and products on the environment by designing and manufacturing products and processes that use natural resources sustainably and reduce the company’s carbon footprint. A global sustainability manager coordinates the environmental management across all sites and is supported by site EHS officers.
In addition, the impact on resource use is also considered when the Group embarks on maintenance or modernization of its worldwide production plants. In the reporting year, investments in property, plant, and equipment amounted to CHF 101.8 million (previous year: CHF 110.9 million).
As a result of the EMS, sixteen of Datwyler’s plants have already achieved environmental certification in accordance with the ISO 14001 standard and other sites are laying the groundwork to achieve this certification. The Swiss plant is also a member of the Energy Agency of the Swiss Private Sector (EnAW).
Water consumption
Most of Datwyler's total water consumption is attributable to the specific requirements of its production processes. Both the cooling systems used in the Food & Beverage division's production and the washing of components in the healthcare sector require significant amounts of water. Specifically, approximately 35% of Group-wide water consumption occurs at the Swiss plant.
The long-term target (2015 to 2025) to reduce relative water consumption per revenue unit by 3% each year is based on this general condition. Over the last seven years, this target has been exceeded on average. In 2022, the absolute water consumption was 8.8% higher than in the previous year. This is due to the acquisition of new sites. Nevertheless, Datwyler is in line with its long-term water reduction targets. Absolute water consumption was reduced by nearly a fourth between 2016 and 2022—from 2.1 million m3 to 1.7 million m3.
Even more informative than absolute water consumption is water consumption in relation to revenue—the best approximation of the development of production output. This observation shows the development of efficiency in water use. The reduction of 10.4% compared to the previous year shows that Datwyler continues to make progress in this area.


| 2018 | 2019 | 2020 | 2021 | 2022 |
|
|---|---|---|---|---|---|
Drinking/industrial water (m³) |
2'086'088 | 1'901'289 | 1'564'028 | 1’523’875 |
1'657'848 |
Water per revenue (m³/CHF millions) |
2'341.0 | 2'076.5 | 1'875.1 | 1’608.1 |
1'440.9 |
Revenue (CHF millions) |
891.1 | 915.6 | 834.1 | 947.6 |
1'150.6 |
For the reporting of water consumption, all 27 production plants are included in 2022. For newly acquired companies, water consumption was included in the first full calendar year until 2021. Accordingly, the water consumption of the acquired companies Parco (USA) and Bins (Brazil) was included for the first time in 2019, as well as Middletown (USA) in 2020. Since 2022, the newly acquired companies are included right after the successful acquisition. The water consumption of the acquired company Xinhui (China) was included for the first time in March 2022 and QSR (USA, Mexico and China) in May 2022. In addition to organic growth at existing plants, the inclusion of acquired companies explains the increase in absolute water consumption.
Energy consumption
Datwyler will also strive to reduce its fuel consumption and electricity consumption relative to revenue by 6% and 3% a year, respectively, by 2025. (For further information on the reduction of Datwyler’s fuel and electricity consumption, please refer to Climate-neutral operations 2030.)
Waste disposal
The EMS system also supported Datwyler in setting a goal to reduce the volume of waste in relation to revenue (tons/CHF million) by 3% annually. This goal could not be reached yet and requires increased attention in the future. But Datwyler has succeeded in increasing the amount of elastomer waste used in downcycled products steadily over the past five years. For example, the company’s process-related elastomer waste is increasingly used in the production of surface coverings for sports fields. With this application, Datwyler increased the amount of recycled waste from 68.3% in 2017 to 70% in 2022, including the newly acquired sites.
Datwyler is also reducing packaging material in the procurement of its raw materials—about one-third of raw materials are now delivered using pallets and delivery boxes that are collected by the supplier for reuse. Non-reusable packaging material made of wood, cardboard, or plastic is recycled by waste management companies. The absolute volume of waste increased by 20.1% from 17'205 tons in 2021 to 20'656 tons in 2022. This is mainly due to the aqusitions of new production sites. However, Datwyler managed to reduce the relative waste volume per unit of revenue by around 1%.

| 2018 | 2019 | 2020 | 2021 | 2022 |
|
|---|---|---|---|---|---|
Total waste (tons) |
14'118 | 14'298 | 14'119 | 17'205 |
20'656 |
of which regular waste (tons) |
12'939 | 13'410 | 13'361 | 16'435 |
19'617 |
of which special waste (tons) |
1'179 | 888 | 758 | 770 |
1'039 |
Proportion of waste sent for recycling |
69.7 % | 72.1 % | 72.6 % | 74.1 % |
70.0 % |
Total waste per revenue (tons/CHF millions) |
15.8 | 15.6 | 16.9 | 18.2 |
18.0 |
Revenue (CHF millions) |
891.1 | 915.6 | 834.1 | 947.6 |
1'150.6 |
For the reporting of waste volume, all 27 production plants are included in 2022. For newly acquired companies, waste volume was included in the first full calendar year until 2021. Accordingly, the waste volume of the acquired companies Parco (USA) and Bins (Brazil) was included for the first time in 2019, as well as Middletown (USA) in 2020. Since 2022, the newly acquired companies are included right after the successful acquisition. The waste volume of the acquired company Xinhui (China) was included for the first time in March 2022 and QSR (USA, Mexico and China) in May 2022. In addition to organic growth at existing plants, the inclusion of acquired companies explains the increase in absolute waste. The accuracy of the waste reporting of the newly acquired companies QSR and Xinhui is not yet complete, but is presented as transparently as possible. As part of the post-merger integration, improvement of the accuracy of their waste reporting continues.

Sustainable procurement
Datwyler prioritizes using quality raw materials to improve its competitive position and guarantee business continuity. Knowing that a socially and environmentally sustainable supply chain is the basis of its sustainable solutions, the company integrates sustainability in the selection and monitoring of its suppliers, seeks long-term supplier relationships, and actively collaborates with its supply chain to stimulate greener products and ideas. Furthering the sustainability of suppliers also supports the advancement of Datwyler’s other focus topics, such as resource-friendly production and eco-design.
Our focus
The purpose of Datwyler’s procurement function is to bring innovative and sustainable solutions into the company, while maintaining focus on cost optimization, availability of raw materials, proactive risk management, and compliance. Datwyler continually works to reduce packaging material and source the most environmentally friendly raw materials possible in order to reduce the environmental footprint of its end products.
A binding Code of Conduct for suppliers and guidelines for sustainable procurement form the basis for ethical and environmentally friendly supply chains. In addition, by systematically embedding ESG criteria into its procurement processes, Datwyler strives to continuously increase the sustainability level of the company’s suppliers. Datwyler's procurement activities focus primarily on suppliers of quality-critical raw materials and products as well as on particularly important suppliers.
Our long-term ambition
Further improve ESG-compliant processes and supply chain and sustainability solutions through suppliers.
Future key targets
Code of Conduct signed by all suppliers
Engage suppliers to further conversations on sustainable solutions
Ensure availability of the most important raw materials through pro-active risk management. This includes, among others local-for-local and whenever possible dual sourcing of materials,
In sourcing, identify five product replacements with better sustainability performance annually by 2030
Our approach
Global standardized guidelines and supplier management processes
Datwyler produces system-critical components that mainly consist of elastomer. Hence, the company primarily buys raw materials such as elastomer materials, plastics, aluminum, metals, and operating materials (some 65'000 per year). To procure these raw materials, the company works with approximately 400 suppliers worldwide, with about one-third of the purchasing volume sourced from the ten largest suppliers. Approximately 65% of raw materials come from Europe, while 20% and 15% come from Asia and the Americas, respectively. Overall, around 1'800 suppliers and service providers invoice Datwyler for more than CHF 10’000 a year.
Datwyler’s Global Procurement Team takes pride in its versatility and various fields of expertise. It provides local procurement teams at each plant with global standardized guidelines and supplier management processes.
The broad and proven supplier base and expertise in Datwyler's procurement teams proved their worth last year, when resources became even scarcer and other challenges in global supply chains led to production constraints for many companies. Despite the additional efforts in procurement, Datwyler continued to drive forward the further development of the sustainability level of its suppliers, which was launched in 2020:
Integrating ESG into supplier selection and monitoring practices
Integrating ESG topics into supplier audits
Encouraging suppliers to suggest more sustainable products and share ideas
Exchanging ideas with suppliers and learning from them
Embedding ESG to improve supply chain sustainability
Selection
Datwyler’s standard Code of Conduct for suppliers forms the basis for its ethical and environmentally friendly supply chains. One of Datwyler’s goals is to have all suppliers sign the Code or present equivalent internal guidelines, and a 2022 analysis revealed that 98% of the quality-critical suppliers (previous year: 97%) were already meeting this requirement. In addition, suppliers must be in compliance with certain ISO norms.
Monitoring and development
In 2020, Datwyler developed its own Supplier Sustainability Assessment program, which is used to monitor the ESG performance of its main suppliers that represent 80% of spend. The program awards points for:
signing Datwyler’s Supplier Code of Conduct
sustainability certificates (ISO 14001, ISO 45001, ISO 50001)
quality sustainability reporting (toward GRI, disclosing of energy, water footprints and work-related incidents)
a supplier code of conduct
a defined position responsible for sustainability
In 2022, suppliers scored 71% of available points (previous year: 67%).
Auditing
Relevant ESG-related ISO norms are also included in all on-site audits.
Complaint management
The company monitors environmental and safety compliance issues that are submitted by suppliers via a dedicated email address.
Training procurement teams
To ensure that the newest guidelines are met, Datwyler provides regular training for its purchasers. In 2022 refresher training sessions for the purchasing employees were conducted to increase awareness.
Facilitating sustainable solutions through supply chain engagement
Sharing ideas
Datwyler engages its suppliers on a yearly base by organizing workshops and meetings that provide a platform for exchanging sustainability ideas.
Encouraging more sustainable product offerings
The company also began encouraging suppliers to propose more sustainable materials to replace existing products completely or to be used in new developments. Several suggestions have been received already, and the goal is to identify five product replacements annually by 2030.
Promoting local sourcing
To support its eco-design priority, Datwyler aims to increase its share of locally sourced materials. After identifying the number of existing local suppliers, packaging materials was selected as a first focus and local sourcing targets were developed. This approach is now also being extended to directly sourced raw materials. This strategy will also reduce the company’s supply chain continuity risks.
Reducing product and service footprints
Datwyler has set a goal to collaborate with suppliers on at least one project a year that targets the reduction of the carbon footprint of a product or service. Some suppliers have already evaluated the footprint of their products and services, and the company would like to have at least one active project per year from 2021 onward. As part of the Scope 3 analysis, the further focus for the next projects with suppliers will be defined.

Proactive reduction of packaging material
Datwyler takes action at various levels to reduce the environmental impact of raw material procurement. Whenever practical and possible, the company has raw materials delivered in large volumes by dry-bulk tankers, which cuts down on packaging materials significantly.
About a third of raw materials are delivered in boxes on pallets, which suppliers reclaim and reuse. Non-reusable pallets and boxes comprised of wood, cardboard, or plastic are recycled via disposal companies.
Striving for environmentally friendly materials
Datwyler is constantly looking for the most environmentally friendly raw materials possible. To this end, the procurement department works with research and development to implement the findings of proactive chemical compliance management. Natural rubber, for instance, has been reduced to less than 1% of purchased elastomer raw materials, thereby helping to preserve rainforest in Southeast Asia and Central and South America.
Recognizing that synthetically produced rubber derived from crude oil has a considerable carbon footprint, Datwyler is currently exploring the option of a synthetic rubber based on monomers derived from plants. In the Food & Beverage business unit, Datwyler, as an innovative partner, is supporting Nespresso to move toward sustainable and traceable aluminum in the spirit of the circular economy.
3.6 Social
In the social area, Datwyler focuses on employer of choice, value driven engagement with customers, safe and healthy workforce and engagement for sustainability.
By focusing on social activities, Datwyler aims to deliver more value and meaningful purpose to its customers, employees, and communities.

Employer of choice
To achieve success in rapidly changing international industrial markets, a qualified and fully committed workforce is vital. To attract the best international talent while fulfilling its social responsibility, Datwyler emphasizes fair and secure working conditions and an attractive, inclusive, and agile work environment. To unlock the full performance potential of its employees, the company also offers in-depth training and development and a strong corporate culture based on the values of «We are entrepreneurs» and «We have respect for others».
Our focus
Ultimately, Datwyler wants to empower employees to create value for customers, the company, themselves, their local communities, and the entire planet. The company promotes equal opportunities, equal treatment, and fair conditions of employment. It focuses particularly on talent and internal leadership development, prioritizing the development of agility and entrepreneurial initiative in every employee.
Our long-term ambition
To collaborate as a diverse and inclusive network of ambassadors and contributors, enabling the company to stay on top of labor market trends and be a great place to work.
Future key targets
Employee commitment rate above industry benchmark for all sites.
Our approach
Composition of workforce
At the end of 2022, the headcount of the continuing operations—including those on fixed-term contracts—totaled 8'698 people (previous year: 6'909). Employees are spread across more than thirty locations in 13 countries, with 39% in Asia, 26% in North and South America, and 35% in Europe. This equated to 8'596 full-time equivalents at the end of the year (previous year: 6'805).
Expressed as an annual average, 10.0% were employed on a fixed-term contract (previous year: 11.2%). The proportion of women in the overall workforce was 35.7% (previous year: 36.4%), while the proportion of women in senior positions was 19.4% (previous year: 18.3%). Based on 8'104 as the average number of full-time equivalents for the year (previous year: 6'710), revenue per full-time equivalent was CHF 141'979 in 2022 (previous year: CHF 141'984).
Datwyler pays fair wages and offers social benefits in line with the relevant country and sector. Personnel expenses, including contributions to the social security funds, amounted CHF 359.2 million in the reporting year (previous year: CHF 321.1 million).
Workers who are not employees and whose work is controlled by Datwyler are part of the temporary headcount reporting. In headcount-reporting Datwyler does not distinguish between employees on Datwyler contracts and those employed through third parties. However, temporary staff are generally hired for functions such as operations and logistics through an employment agency and therefore do not have an employment contract with the Datwyler Group.
Some of the manufacturing locations rely on temporary staff during peak production periods, while other manufacturing locations, particularly in the USA, hire first through third parties and take on the best-performing employees on a permanent basis with Datwyler. The turnover of temporary employees is not tracked in detail.

Promoting entrepreneurial initiative
Management at Datwyler is based on concrete and inspiring objectives, which are broken down and assigned to the various levels within the hierarchy. The company uses the concept of Objectives and Key Results (OKR) for this purpose. For each selected objective, several key results and related activities are defined that are specific, timebound, and challenging in order to foster thinking and acting on what matters most. For each key result, there is a responsible person who coordinates the alignment of activities to meet the objectives at all hierarchical levels and in all units of the company. Activities are regularly reviewed and adjusted if necessary, and the objectives and key results are transparent and observable by all employees. In this way, Datwyler delegates responsibility for achieving goals to volunteers across the full organization, promotes its network cooperation and increases entrepreneurial initiative and customer focus across the business.
Agility to strengthen competitiveness
Increasing agility is a key strategic priority for Datwyler. In this way, the company promotes the organization’s adaptability to rapidly changing conditions and further strengthens collaboration across departmental boundaries and hierarchical levels. Important projects were announced on the Datwyler intranet since 2022, including purpose, project set-up and required roles. Volunteers have the chance to apply and join diverse international teams besides their responsibilities in the line organization. In this way, learning experience and visibility to top management were combined with driving the business forward. This is what Datwyler calls true empowerment in a network organization
Leadership development / WeLead program
Datwyler is creating an environment for agility to be lived in everyday life and for employees to make full use of their talents, skills, and creativity. To this end, the company offers its leaders targeted training that helps them to create a culture where everybody feels appreciated, respected and empowered for who they are and for what they do. The company’s internal WeLead program—a series of seven training initiatives, each with its own learning objectives leading to different, yet aligned results—is the basis for its systematic talent management and the foundation to apply appropriate leadership styles in a VUCA (volatility, uncertainty, complexity and ambiguity) world.
In 2022, 187 Datwyler employees participated in 16 sessions of WeLead trainings. Participants rate their overall experience with these programs highly. Positive elements are high interactivity level and mixed delivery methods (input sessions, breakout group work, plenary discussions, individual coaching). It is well balanced between theoretical input and practical application of content learned. Content and speed are adjusted in real time to the pace of the group, which is functionally, culturally, and geographically diverse. Participants highlight the safe space they experience for learning. To keep the quality of courses at the highest level and to deliver learning experience also in the local language, in 2022 Datwyler invested in trainers, who conduct the sessions in Mexico due to regional growth and demand.

Talent and succession management
In 2022 Datwyler further improved the talent and succession management formally introduced in 2020. Involving top leaders, more than 10 conferences have been held on site, in Business Units/Areas and with the Management Board.
Talents have been assessed, identified and discussed for Key positions to safeguard succession planning. Common criteria on assessing employees’ potential and the use of reliable and valid assessment-methodologies contribute to the Diversity, Equity and Inclusion principles.
For talents individual development plans including on and off the job activities have been established to prepare them for future challenges. External offerings focus on general management, strategy development, business acumen and leadership behavior in an ambiguous world. In addition “Working out Loud” Circles have been introduced to strengthen internal networking and peer coaching.
Learning and development
Datwyler envisions becoming a self-learning organization and invites everyone to become the best version of their true self. For Datwyler, learning and development is one of the cornerstones to cultivate the culture and learning mindset necessary to sustain that vision. In 2022, Datwyler has agreed on their learning and development strategy which will help to focus and prioritize their actions.
The Datwyler Academy is part of the learning and development strategy and is growing step by step. After the decision on the Learning Management System (LMS platform) the internal and external offering is steadily increasing.
In 2022, the number of active learners almost doubled to now 3’200. Around 150 courses – internal and external – have been offered on the LMS platform), which had more than 25’000 sign-ins in 2022. Almost 9’000 courses have been completed, including mandatory ones like the Code of Conduct training.
Performance management
Updated pay philosophy and global job architecture
The payphilosophy supports the four core values of the Datwyler Group:
We are entrepreneurs.
We excel at what we do.
We bring value to our customers.
We have respect for others.
It was updated in 2022, where Datwyler successfully conducted a job architecture and grading project within the full group. It was the very first time that all the functions were assessed around the globe on common standards. It was another step forward to increase equity and fairness – internally and externally. For 2023, implementation of the new grading country by country will be one of the core tasks in the field of HR.
Reward team effort
In 2020, Datwyler redesigned its concept for the variable incentive. Individual goals were set aside and replaced by common corporate goals. This system was further improved in 2021. Starting from 2022 onwards, sustainability targets have been included in the variable incentive. Employees have been continuously informed about the efforts, e.g. relating to the reduction of CO2 or the accident severity rate. Site-specific reporting has been adjusted to make these important KPIs visible to all employees.
By taking sustainability measurement parameters into account in the variable incentive for more than 1’000 eligible employees, Datwyler is promoting awareness of the sustainability focus areas.
Personal performance appraisals support development
While individual targets for the award of variable remuneration are a thing of the past at Datwyler, individual targets remain in place to support the personal development of each employee. At least once a year, leaders and employees engage in a structured dialog to discuss key tasks, Datwyler competences, and to agree on development opportunities both on and off the job.
Diversity, Equity, and Inclusion
Datwyler has zero tolerance for discrimination, humiliation, oppression, harassment, or insults relating to anyone’s gender, origins, nationality, culture, religion, or color. This is clearly laid down in the Code of Conduct, with punishments ranging from sanctions to dismissal.
Datwyler’s Diversity Council, which was established in 2021 based on the DEI policy, had six meetings in the course of the year 2022. The diverse team including the CEO developed the following vision statement for the Council: «Our vision is to create an inclusive culture, where all of us can flourish – and build a sustainable future, together.». The council analyzed the as-is situation in various fields of DEI, initiated projects to improve the status quo e.g. in the field of gender diversity, which were included in the OKR system. So tangible progress has been achieved in the field of female employees in management positions, where the quota increased from 18.3% to 19.4%.
No claims of potential discrimination within Datwyler companies were received in 2022.
Employee surveys
Employees who are happy, motivated, and willing to accept change are the backbone of a company because they work hard. They should make up a substantial proportion of the workforce. To measure employee satisfaction and engagement on a range of parameters, Datwyler regularly conducts a comprehensive employee survey, most recently in 2020 for the full group. The next survey takes place in January – February 2023.
In addition, surveys were conducted in 2022 on existing sites in US and Italy and on all sites of the newly acquired companies QSR and Xinhui. The results were positive overall. Especially in the newly onboarded companies, the way in which integration has been realized has been highly appreciated. Besides surveys many culture workshops have been successfully conducted. As a result of the various surveys, which all have been non-paper based, action plans on a site basis were developed. Follow-up on improvement measures is ongoing.
Employee benefits and recognition
The slogan #FOR YOU serves as an umbrella for a range of benefits and initiatives at Datwyler that support employees and make them feel valued. The program is constantly growing and organized around five pillars:
Health
Well-being
Work environment
Ideas/involvement
Personal development
Of continuing importance to Datwyler and its employees from a number of perspectives is the issue of language. On the one hand, cross-border communication and thus cooperation depend on the possibility of linguistic understanding. On the other hand, foreign language skills are also a valued personal development. For this reason, offers for the further development of foreign language skills are also provided under the slogan #FOR YOU. Datwyler employees with English skills at all hierarchy levels are offered the opportunity to gain international experience by working on short-, mid-, or long-term assignments at its plant in Delaware in the United States. In China, the site initiated a project to meet physically and support each other building English language skills. Participants present technical themes to each other in English and while relevant content and knowledge is shared, they help each other to build confidence in speaking and presenting in English.
Employee structure
2022 |
2021 | Change | |
|---|---|---|---|
Headcount annual average |
8'191 |
6'794 |
+20.6 % |
thereof female |
35.7 % |
36.4 % |
n/a |
Average permanent headcount |
7'371 |
6'035 |
+22.1 % |
thereof female |
36.9 % |
38.1 % |
n/a |
Average temporary headcount |
820 |
759 |
+8.0 % |
Average full-time headcount |
7'145 |
5'830 |
+22.6 % |
thereof female |
36.2 % |
37.4 % |
n/a |
Average part-time headcount |
205 |
188 |
+9.0 % |
thereof female |
62.4 % |
63.8 % |
n/a |
Average headcount with higher management function |
227 |
169 |
+34.3 % |
thereof female |
19.4 % |
18.3 % |
n/a |
Headcount end of period |
8'698 |
6'909 |
+25.9 % |
Employees joining (new, growth in existing functions/replacements) |
1'271 |
1'447 |
–12.2 % |
Employees leaving |
1'348 |
994 |
+35.6 % |
thereof voluntary leaves |
1'129 |
911 |
+23.9 % |
Rate of new hires |
17.2 % |
24.0 % |
n/a |
Turnover rate |
15.3 % |
15.1 % |
n/a |
The information on employees relates to the continuing operations. The turnover rate is calculated by dividing the number of those leaving voluntarily by the average headcount for the year (not including temporary employment contracts).
Voluntary leaves
2022 |
2021 | Change | |
|---|---|---|---|
Male |
635 |
505 |
+25.7 % |
turnover rate |
13.6 % |
13.5 % |
n/a |
Female |
494 |
406 |
+21.7 % |
turnover rate |
18.2 % |
17.6 % |
n/a |
Under 30 |
407 |
333 |
+22.2 % |
30-50 |
603 |
513 |
+17.5 % |
Over 50 |
119 |
65 |
+83.1 % |
Higher management (mgmt) |
24 |
19 |
+26.3 % |
Team leader (tl) |
8 |
5 |
+60.0 % |
Office worker (excl. mgmt & tl) |
126 |
101 |
+24.8 % |
Production worker (excl. mgmt & tl) |
971 |
786 |
+23.5 % |
Full-time equivalents average YTD |
8'104 |
6'710 |
+20.8 % |
The information on employees relates to the continuing operations.
Full-time equivalents
2022 |
2021 | Change | |
|---|---|---|---|
Full-time equivalents end of period |
8'596 |
6'805 |
+26.3 % |
thereof in Asia |
38.7 % |
35.3 % |
n/a |
thereof in North and South America |
26.1 % |
19.4 % |
n/a |
thereof in Switzerland |
7.0 % |
9.5 % |
n/a |
thereof in rest of Europe |
28.2 % |
35.8 % |
n/a |
The information on employees relates to the continuing operations.

Value-driven engagement
with customers
The needs and requirements of customers are at the heart of everything Datwyler does. The only way a business can enjoy sustainable success is to make sure its customers are completely satisfied. Two of our corporate values—«We are entrepreneurs» and «We bring value to our customers»—speak to the importance of this perspective.
Customer retention takes more than just high-quality customer service. Datwyler truly values its relationship with customers, designing its products and solutions to not only fulfill the highest expectations in terms of functionality and quality but to also do their part to support the customers’ sustainability performance and goals. The majority of Datwyler’s customers operate in socially important market segments. Together with them, Datwyler can amplify its impact and create high-quality end-consumer products that save lives while also helping to save the planet.
Our focus
With more than 100 years of experience and a global production footprint, Datwyler’s material, engineering, and production expertise helps make it a market leader for system-critical elastomer components. Efforts to constantly improve allow the company to continually expand its innovative portfolio of products and services.
This keeps customers at the forefront of technological advancement by consistently engaging with them to demonstrate its dedication to their needs. Datwyler has a zero defects philosophy and applies Quality by Design principles in its design and manufacturing processes. Sustainability has become another integral part of Datwyler’s value proposition to customers and helps the company differentiate itself in the marketplace.
Our long-term ambition
Perceived as a sustainability leader by customers.
Future key targets
High rankings in customer service rating for sustainability.
Our approach
Supplying system-critical elastomer components
The elastomer components Datwyler produces for specific customers are system-critical parts. They are a key contribution to ensuring systems function properly and safely for customers in the socially important global Healthcare, Mobility, Connectivity, General Industry and Food & Beverage market segments.
Datwyler’s core competencies
Datwyler’s core competencies of solution design, material expertise, and operational excellence form the basis for its value-driven engagement and co-engineering approach with customers across industries. They allow Datwyler to support customers as a development partner—from the original design study and prototype phase through to global production of billions of parts based on a zero-defect philosophy throughout the entire life cycle of the product.
The value of Datwyler’s core competencies is becoming increasingly apparent to its globally active customers as they run ever more powerful and complex systems.

Integrating sustainability into customer engagements
Datwyler is increasingly marketing its ambitious sustainability strategy and how it can add value to customers. All global customer-facing teams are trained on Datwyler’s sustainability program and encouraged to always include sustainability in the value proposition presented to customers. It doesn’t matter if it is during a 30-minute call or three-day workshop, one of Datwyler’s main customers or a new lead, a multinational or a small start-up company. It is Datwyler’s explicit goal to encourage sustainability-related collaborations with customers to maximize impact.
Systematic complaints management
Datwyler maintains a systematic approach to complaints management with a global process and uniform database. The internationally recognized 8D reporting concept is used to process complaints and resolve the underlying problems. Datwyler also endeavors to define detailed product specifications with customers in advance to avoid the potential for future complaints. The aim is to continuously reduce justified complaints compared to the previous year.
Customer satisfaction
Datwyler regularly surveys customer satisfaction—most recently in 2020, where a Net Promoter Score (NPS) of 8.0 was achieved. The survey revealed a positive and consistent image of Datwyler and a high level of satisfaction across different markets, customer sizes, and roles. The next customer survey will take place in 2023.
For the future, a specific sustainability survey for customers is planned.

Continuous improvement process
Datwyler uses the results of customer surveys and complaints management to identify and implement measures for improvement. These are part of the systematic management process and thereby help ensure the service customers receive keeps on getting better. For example, Datwyler uses Tech Days on site with existing and potential customers from the Mobility business unit to strengthen relationships and raise awareness of its competencies and offerings. Doing business with Datwyler must be simple for existing and potential customers.
This is why the company wants to develop an even better understanding of the future requirements and needs of its markets and customers. This kind of proactive approach will help Datwyler benefit from changes within the international supplier industry, since customers in global market segments have been steadily reducing the number of suppliers they use and tending to work more closely with those they retain. Datwyler is thus increasingly becoming a development partner with the ultimate aim of saving costs and conserving resources.
Customer health and safety and chemical compliance
Datwyler meets a variety of chemical law requirements at its production locations as well as additional industry and customer-specific rules. Almost all Datwyler Group products are subject to statutory information obligations in the countries of use. Chemicals legislation and the EU REACH regulations regarding the physical composition of products are of particular relevance. REACH (EU Regulation 1907/2006) governs the registration, assessment, and approval of chemical substances within the European Union.
With its proactive chemical compliance management, Datwyler goes above and beyond legal requirements, setting leading standards worldwide in the elastomer industry. Again, in the 2022 reporting year, Datwyler recorded zero incidents of non-compliance with provisions of conduct relating to the impact of products on the health and safety of users.

Safe and healthy workforce
A safe and healthy workplace is of utmost importance to Datwyler. Good health and safety measures not only reduce injuries and illnesses for employees, they secure long-term benefits for Datwyler by reducing absences and ensuring that the workplace is more efficient and productive. With the integrated Datwyler Production System, workplace safety and health management are an integral part of the company’s drive for operational excellence.
Our focus
An accident- and injury-free vision is strongly embedded in Datwyler’s corporate strategy. This ensures the commitment of the company and those responsible under its Code of Conduct to ensuring a safe working environment and providing employees with regular training.
This focus applies to the technical planning of workplaces, facilities, and processes, and to safety management and people’s individual behavior as they go about their day-to-day work. Furthermore, each site has its own targets to guide their performance and make Datwyler’s corporate strategy more tangible.
Our long-term ambition
Zero accidents and zero injuries and a healthy working environment.
Future key targets
0.25 accident-related days of absence a year per full-time equivalent and four days of absence due to illness a year per full-time equivalent on company level.
Our approach
Established health and safety management
Datwyler is committed to protecting the health and safety of all employees, contractors, or visitors by planning, managing, conducting, and supervising its work in compliance with legislation and best practices. One priority of Datwyler’s health and safety management is to develop and coordinate health and safety systems and processes at a global level to prevent accidents and improve health and safety conditions at production sites. A task group coordinates global workplace safety and health initiatives in cooperation with Human Resource Management. Technical support is provided to specific sites as needed by a local EHS manager, who oversees deployment and follow-up of processes.
To ensure state-of-the-art health and safety awareness, plants hold regular training and audits and encourage employees to report any safety observations. Findings from these audits and individual accidents on site-level are reported to a central database that is accessible to all plants to enhance learning. These regular audits ensure health and safety compliance, good practices, continuous training, and advance site certification. Already, sixteen of Datwyler’s production sites are ISO 14001 certified, and eight sites are ISO 45001 certified. As these eight plants comprise nearly half of Datwyler’s employees, they are instrumental in increasing safety awareness on an employee level. By ensuring that unsafe actions and conditions are identified and eliminated on a regular basis, employee health and safety is further advanced.
In the production plants of the two business areas Healthcare Solutions and Industrial Solutions, there were 1'319 days of absence due to workplace accidents in 2022 (prior year: 2'099). Expressed per full-time equivalent, this figures equates to 0.17 days of absence for the year as a whole (prior year: 0.31).
The Datwyler target of 0.25, which is the «Good Practice» benchmark set by SUVA, the Swiss Accident Insurance Fund, could therefore be achieved. Higher than accident-related absence is absence due to illness. this amounted to 48'340 days in the reporting year (prior year: 44'736).
This equates to 6.37 days of illness per full-time equivalent (prior year: 6.67). This value is above the medium-term Datwyler target of four days of absence due to illness a year per full-time equivalent.
The data includes both permanent and temporary employees and covers all sites except Xinhui (China) and the QSR sites in the USA. As part of the post-merger integration, these sites are still working on recording absence figures. Datwyler is employing systematic absence management and individual consultations to continuously work on further improvement of the work environment aiming to reduce the absence rate and keep employee motivation high.
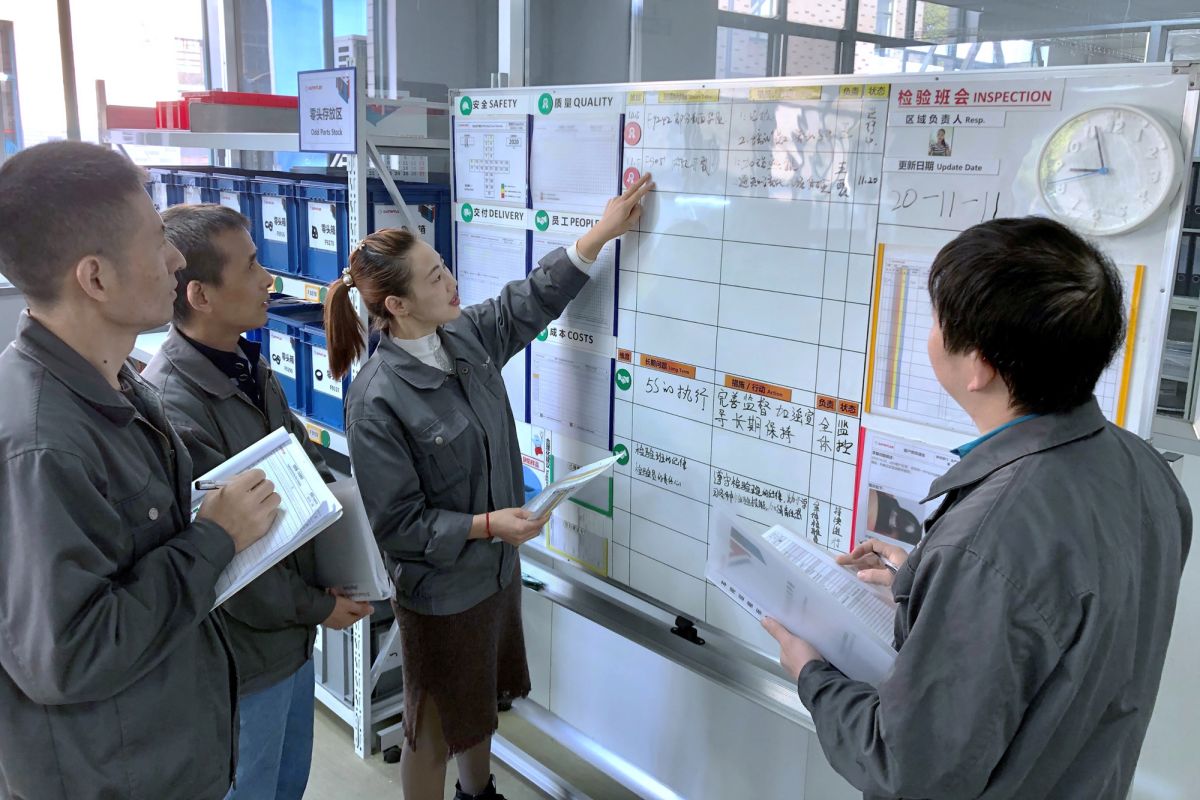
Absences
2022 |
2021 | Change | |
|---|---|---|---|
Total available working days FTE (TAWD) |
1'946'404 |
1'840'544 |
+5.8 % |
Total absences other than vacation days |
83’978 |
67'313 |
+24.8 % |
Total absences other than vacation days in % of TAWD |
4.3 % |
3.7 % |
n/a |
thereof absences due to work related accidents (days) |
1'319 |
2'099 |
–37.2 % |
Work related accidents in days per FTE (annual average) |
0.17 |
0.31 |
–44.0 % |
thereof absences due to illness (days) |
48'340 |
44'736 |
+8.1 % |
Illness in days per FTE (annual average) |
6.37 |
6.67 |
–4.6 % |
FTE = Full time equivalent. TAWD = Total available working days. The information on absences relates to the continuing operations.
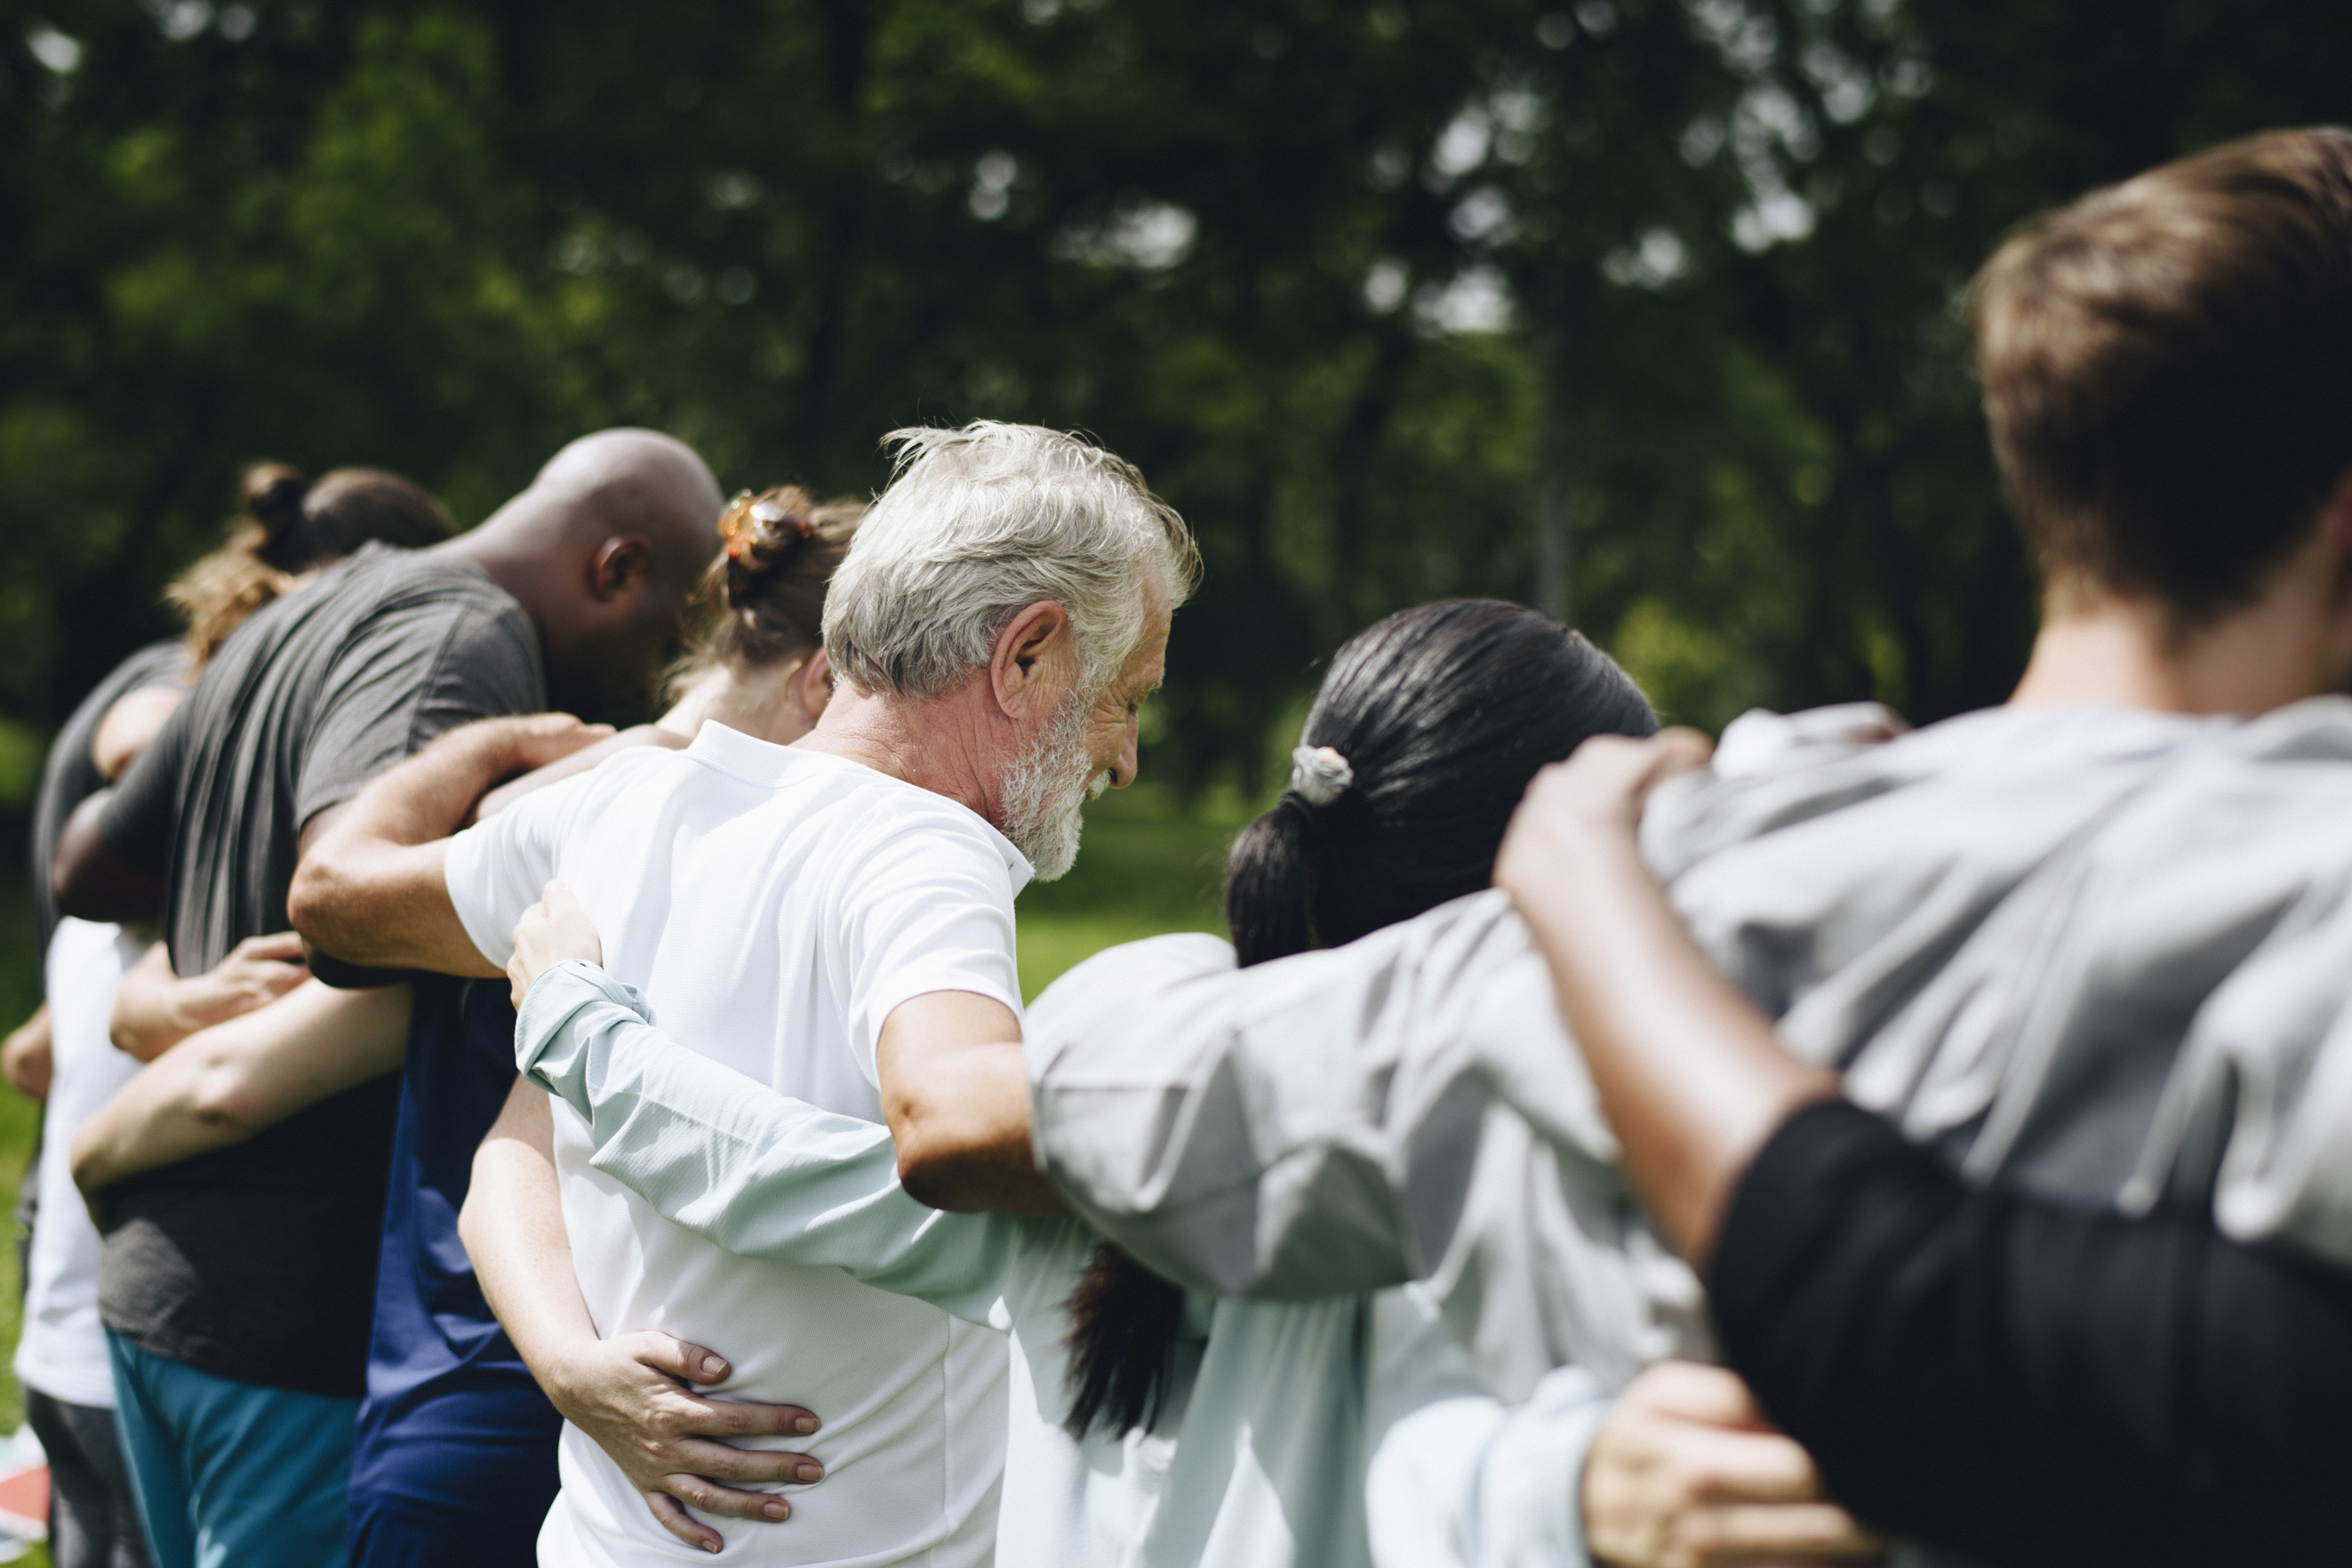
Engagement for sustainability
Datwyler is often among the largest employers in the regions where it operates. With this comes a responsibility to elevate local communities by supporting charitable projects. Enabling employees, who are typically part of these communities, to volunteer also creates a sense of pride and belonging and benefits Datwyler’s reputation both as an employer and community member.
Our focus
Datwyler supports its local communities not only through wages and tax payments, but also through donations, volunteering and engagement, education, and improvement of local infrastructures.
Our long-term ambition
Engage Datwyler people at all locations in relevant community work.
Future key targets
At least one external community activity per location, per year.
Our approach
Benefitting society
Datwyler supported the charity organization, Help4Ukraine, which was founded by a few current and former Datwyler employees. The company organized a Datwyler Donation Week at all its locations. Datwyler doubled the amount of money donated by its employees.
Benefitting local communities
As a large regional employer, Datwyler’s bigger sites generate considerable direct and indirect economic benefits for the local area. Municipalities benefit not only from the tax paid by Datwyler companies and its employees. Also the community projects that every site runs locally make a positive difference. As a guideline for community projects, Datwyler explicitly focuses on activities in the area of education, critical human needs, and inclusion of minority groups.
The goal is to have at least one active local community engagement project at every location. Datwyler is consistently sharing its community efforts internally and/or externally to create a butterfly effect and inspire each other to go the extra mile. The company encourages bottom-up input of powerful ideas from all colleagues around the globe, since they know best what matters most locally.
It is great to see some examples where global multi-disciplinary teams dedicate time of their team’s workshops to contribute to the community. This not only positively impacts the community, it creates unique bonds in the team while volunteering.
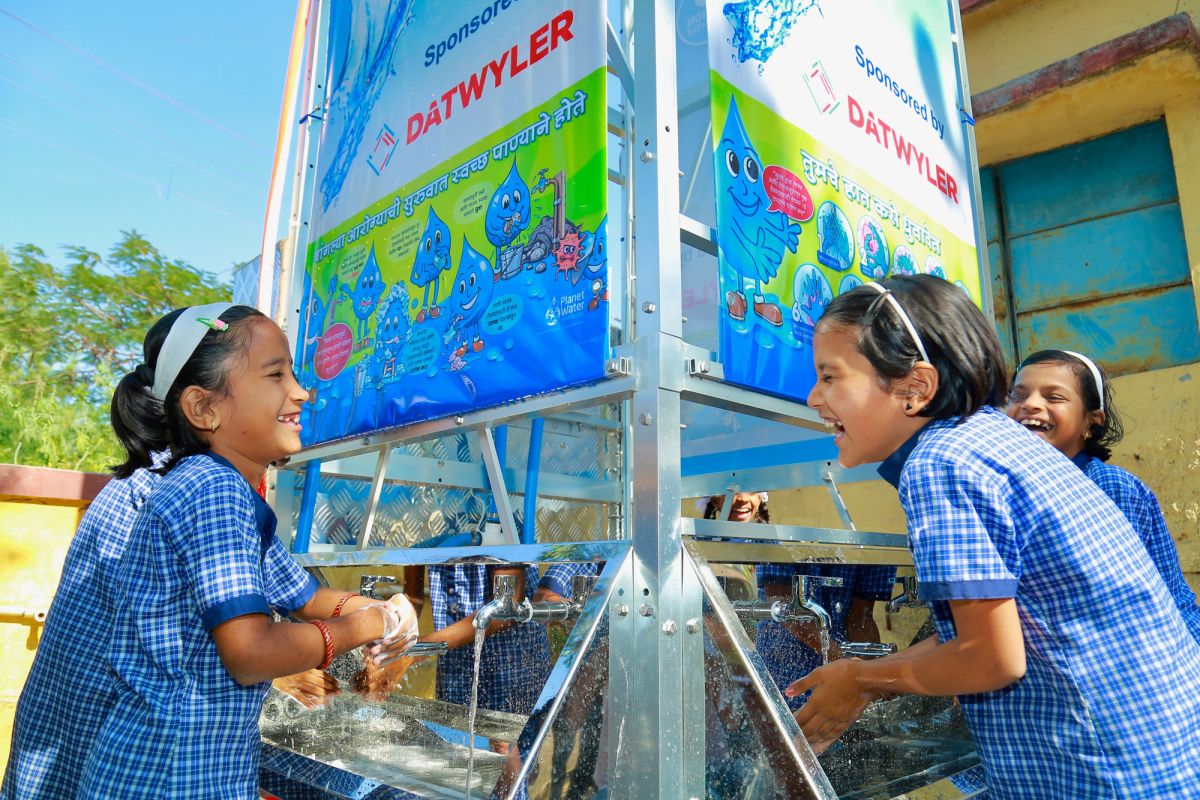
3.7 GRI content index
Datwyler’s Sustainability Report 2022 is an integral part of the Annual Report 2022. The reporting was compiled in accordance with GRI Standards 2021. The GRI Content Index can be found online at the link below.